Buy low and sell high is the most common investment axiom. Buy stocks or ETFs when prices are low, and hold them until they are high. Rinse and repeat. Easy, right? We wish it really was that easy.
During any investment career, a participant will learn – sometimes painfully – that no matter how well you buy a stock based on rigorous valuation analysis, there are market factors at play that will impact how well that stock does.
For Canadian stocks, one of these factors is the valuation of the entire stock market. Put simply, if the TSX is expensive then future returns tend to be lower. If the TSX is cheap by historical comparison, there is a much better chance of increased returns. The key is determining when the overall market is priced lower or higher compared to historical valuations. One of the key inputs I use as part of this analysis is the Cyclically Adjusted PE Ratios, or CAPE ratio for short.
What is the CAPE Ratio?
The CAPE ratio was developed by Professor Robert Shiller and takes the last ten years of inflation-adjusted earnings data to produce a normalized price to earnings ratio. With this normalized price to earnings ratio, an investor can gauge whether a stock or market is undervalued or overvalued when compared to the median adjusted historical earnings ratio.
From this assessment of the market being under or overvalued, an investor can then make a judgment as to the potential for future returns.
At its simplest level, it works like this:
- If the current CAPE ratio is below the historical median CAPE ratio, then there is a better probability of higher than average returns going forward.
- If the current CAPE ratio is above the historical median CAPE ratio, then there is a lower probability of higher than average returns going forward.
It is important to remember that the CAPE ratio does not provide buy or sell signals. Instead, it simply gives you an idea of where the market is regarding valuation based on historical earnings, and the level of returns you can expect over the next ten years.
Here is a chart that explains this in real numbers. This chart shows us that the lower the CAPE ratio, the higher the average ten-year return based on the starting CAPE ratio. For example, when buying a market with a CAPE ratio of 10.8 to 11.9, investors can expect average returns over the next ten years to be greater than 10%.
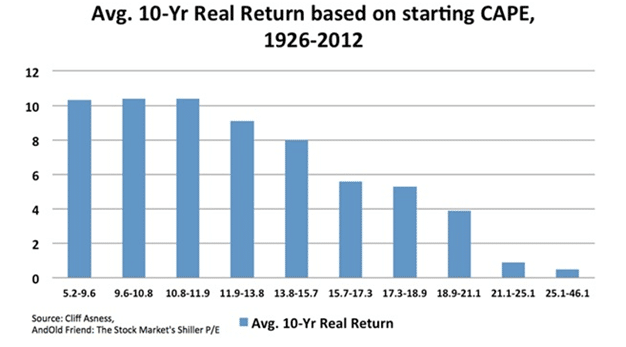
It is also clear that the higher the CAPE ratio, the lower the expected 10-year average returns will be. Another important factor to recognize: just because a CAPE ratio is higher than the historical median CAPE ratio, does not mean the market cannot either continue to go higher or stay high for years. The chart below highlights what the US CAPE ratio has been going back to before the 1900’s. Notice how it can stay above and below the median line for long periods of time.

The CAPE Ratio – An Example
To better explain how the CAPE ratio works, let’s look at an example using the U.S. stock market with data obtained from the Research Affiliates:

Based on current valuation numbers as of this writing, the current CAPE ratio for US large cap stocks is 30.3, which is the 97th percentile. The median value based on a historical look back, is 16.1. Research Affiliates also calculates a “fair value” based on their model, which puts a fair value CAPE ratio at 22.9.
Regardless of using either the median CAPE ratio or the Research Affiliates fair value number, this analysis tells us that the US large cap market is more expensive than normal. This is a flag that there is a higher probability of lower than average returns over the next few years.
Using the CAPE Ratio in Canada
The beauty of the CAPE ratio is that it can also be calculated for the Canadian stock market. In fact, the same site I used for the above example runs the CAPE ratio calculation on the Canadian stock market.
Based on Thursday, October 6th’s calculation, the Canadian market looks to be fairly priced, with the current CAPE ratio at 19.6, which places it slightly higher than the median at 19.1.

However, as we learned above, the CAPE ratio is not just about determining if the market is fairly priced. The additional value that comes from the CAPE ratio is determining future expected returns. Granted, predicting the future is about as hard an exercise as it gets; but, the CAPE data can give us a higher probability of estimating what we might achieve regarding future returns.
Based on a current CAPE of 19.6, and using the chart above that shows the expected ten-year average returns for CAPE ratios, Canadian investors can expect to see returns in the 4% range.
Not exactly the type of return anyone investing in equities would desire over the next ten years. I believe there are better returns available in the global stock market and or with individual Canadian stocks.
More Favourable CAPE Ratios
With the Canadian stock market fairly priced, but with lower potential ten-year returns, I think there are better opportunities for my investment dollars right now.
One investment strategy, introduced and well researched by Meb Faber in his book Global Value, is to sort all the country stock markets in the world by CAPE from lowest to highest and buy the bottom ten. This investment approach will mean that you are buying ten of the lowest valued stock markets in the world with the intention of capturing the higher gains that low CAPE ratios have shown to deliver over the next ten years of market activity.
Sometimes Canada is going to be in that list, and other times it won’t be. Here is the current list of the lowest ten countries, sorted by CAPE:
- Russia: 5.4
- Turkey: 11.0
- Brazil: 11.8
- Poland: 12.0
- Spain: 12.9
- United Kingdom: 13.9
- Italy: 13.9
- South Korea: 14.5
- China: 15.2
- Europe: 15.5
The associated ETFs can be bought for each of these countries, and then held for ten years. If you want to be slightly more active in your approach, every year the ranking can be done again and the countries that fall out of the lowest ten can be replaced by the new countries. However, since the values do not tend to change drastically, there can be periods of time where no change-outs are needed.
It is important to remember that this approach is not a short-term strategy and it means holding onto some country ETFs for ten years or longer to let them play out their expected returns. It takes commitment in the strategy, but it can produce higher than average returns.
As Canadian investors, we are always looking for opportunities to invest in our home country. However, I am also trying to maximize my investment returns, and if index investing is your forte there may be better options globally. Today, Canada’s CAPE ratio is telling us just that.