On Friday, May 28, as Americans prepared to relax for Memorial Day long weekend, President Biden and his staff slipped out a US$6 trillion budget proposal for the fiscal year 2022.
As the pandemic fades away in the United States, President Biden is preparing to spend like never before in America’s history.
In addition – citing recovery spending, low interest rates, and social justice – the United States government is hoping to boost revenue by increasing taxes on America’s wealthiest. Yet again, neglecting the biggest problems hurting their economy – runaway inflation and higher borrowing costs.
The proposed US$6 trillion budget for the year beginning Oct. 1 will see a massive increase in infrastructure spending and numerous social programs such as paid family leave and universal preschool. And while some Democrats may want to scale back the President’s first budget, it appears the blue party has enough control to pass this Bill in one form or another.
Context for Biden’s Spending Spree
Reuters article, Money is cheap, let’s spend it – White House $6 trillion budget message, notes the following about the proposed budget:
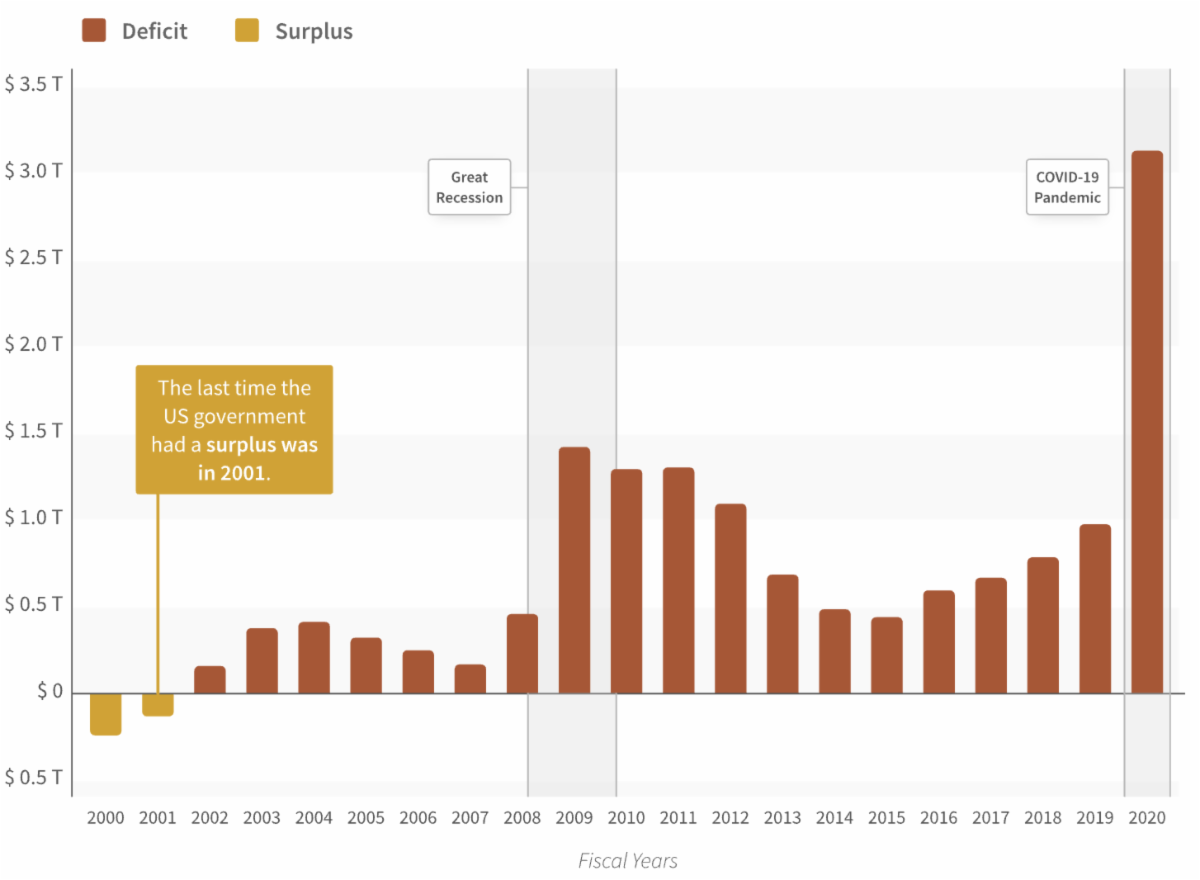
“It projects a $1.84 trillion deficit, a sharp decrease from the past two years because of the COVID-19 pandemic, but up from 2019’s $984 billion.”
So, even with tax hikes across the board, the post-pandemic U.S. economy (which appears to be roaring back to life) is projected to print a US$1.84 trillion deficit next year – stunning, to say the least.
What’s more, this new deficit would exceed the budget deficit of 2009 – which came in at a then unthinkable US$1.4 trillion – by US$440 billion.
Deficit Spending Over the Past 20 Years
Naturally, Biden’s US$1.84 trillion deficit assumes that the high earners and wealthy will not find ways around the hundreds of billions in new taxes they are expected to fork over in the new tax regime.
The Wall Street Journal reported that Biden is proposing that the,
“…corporate tax rate would rise to 28% from 21%, the top capital-gains rate would rise to 43.4% from 23.8% and unrealized capital gains would be taxed at death with a $1 million per-person exemption.”
And CNBC’s early estimates are that the tax increase proposal,
“…seeks to raise $1.5 trillion over a decade via higher taxes on the top 1%.”
Knowing full well that many of the rich will try to shield their gains from being taxed any further, the U.S. President is also beefing up regulation to thwart any such attempts.
According to the Wall Street Journal,
“The administration is also proposing an expansion of the Internal Revenue Service that would double its staffing over a decade and is projected to yield $700 billion in net savings from tougher tax enforcement.”
It’s unusual for the top 1% to skip town simply to avoid paying taxes. Decaying infrastructure, rising crime, and homelessness are more often reasons that push people away from home. Think California. Right now, the Golden State is experiencing an unprecedented exodus. For the first time since its founding in 1850, the State of California recorded a population decline of more than 182,000 people last year alone.
With Biden preparing to soak the rich and run historic deficits, we can’t help but wonder: will this actually work?
The Hidden Tax Affecting Us All
Two deeply related trends could stop the Biden administration’s spendthrift ways in its tracks: Runaway inflation and higher interest rates.
For just about anybody, the last decade and especially the last few years have been a great time to borrow. Being one of the largest debtor nations in the world, the United States has benefited tremendously from this environment.
A glance at the paltry US$300 billion in net interest paid in 2020 tells the story.
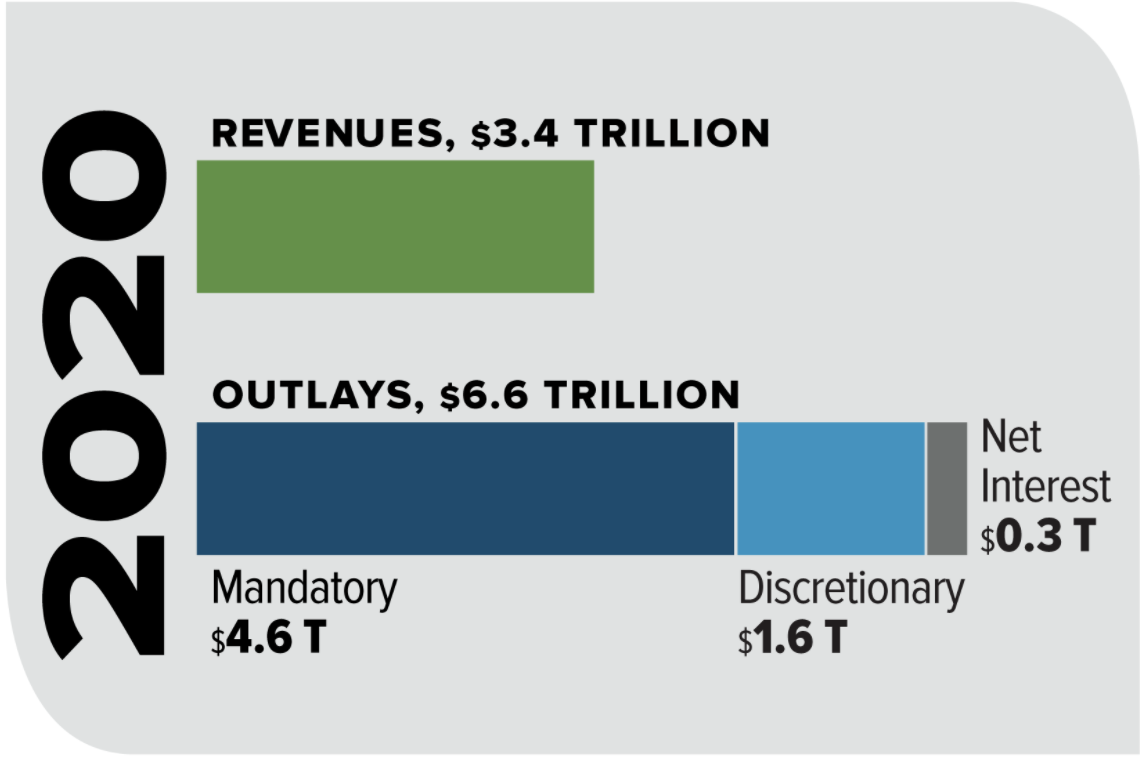
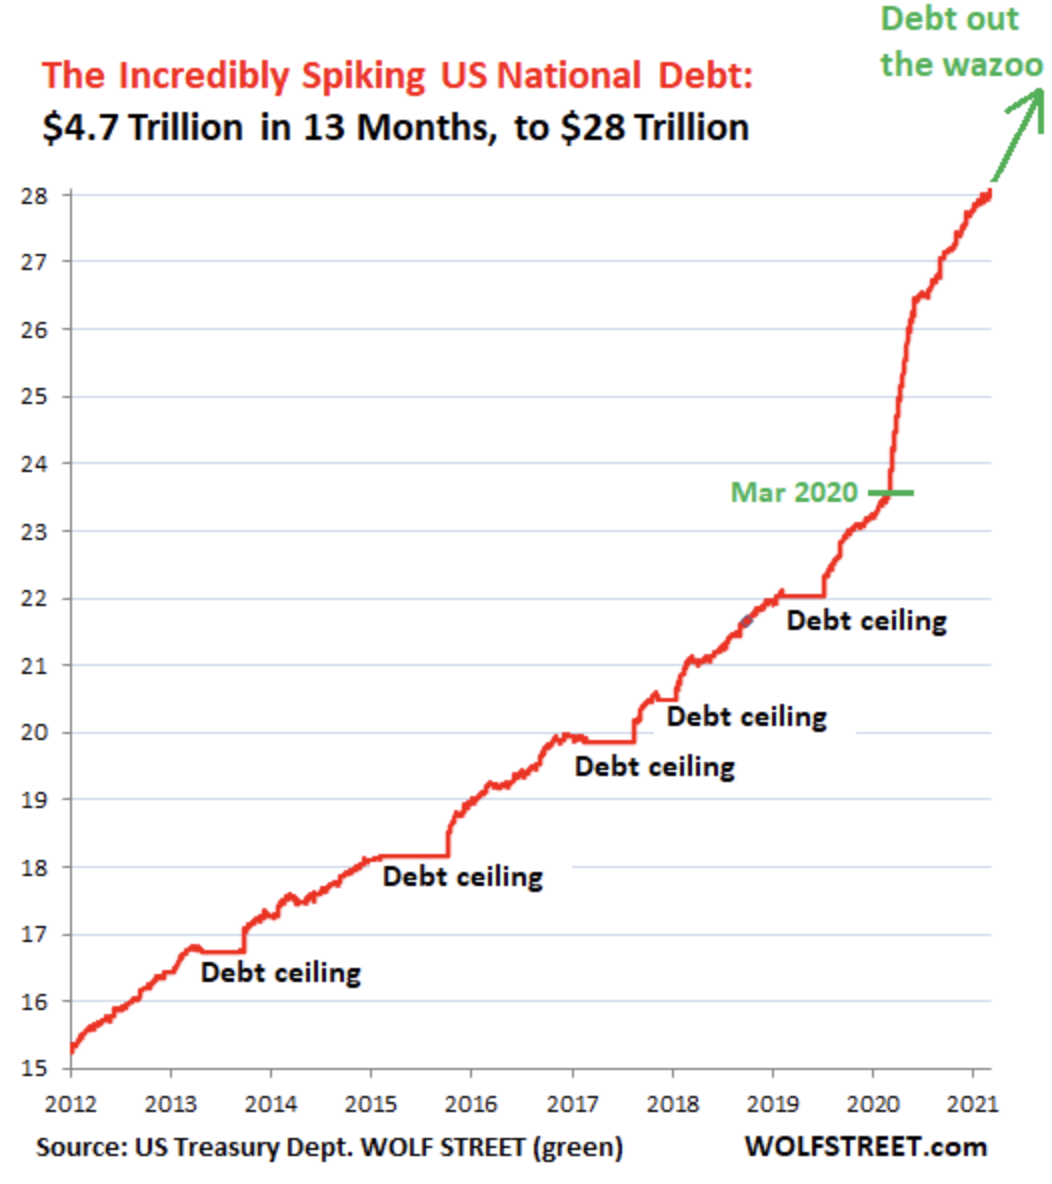
Note that the US$300 billion in net interest paid above is tiny relative to the U.S. national debt, which eclipsed US$28 trillion a few months ago.
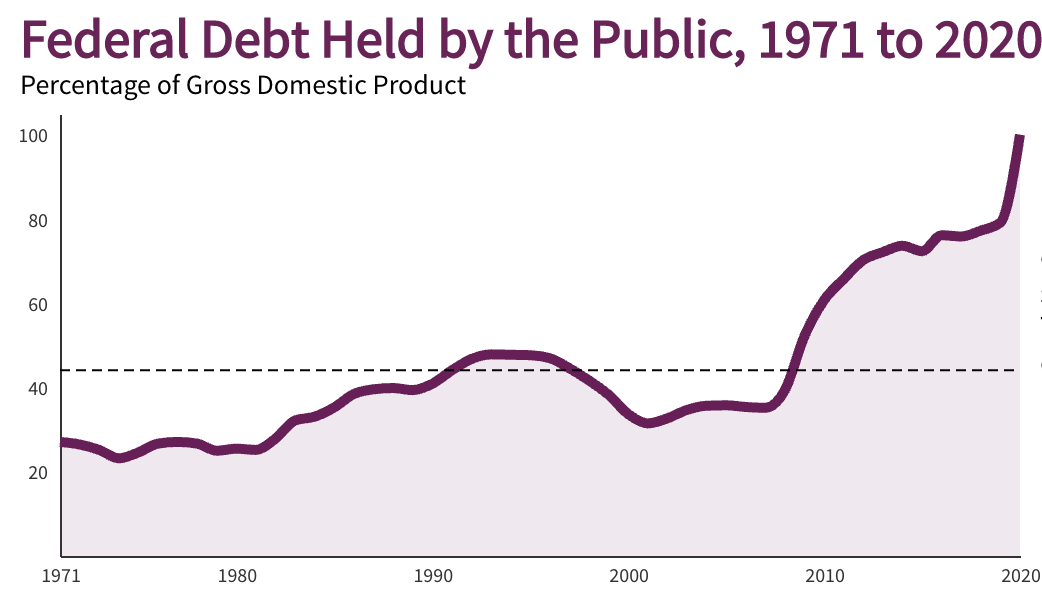
However, if interest rates rise, net interest payments may quickly approach US$1 trillion, equal to about 25% of the $4 trillion expected to be collected in tax revenue in the 2022 fiscal budget. With the federal debt already above 100% debt to GDP, an increase in interest rates could be extremely problematic for the U.S. economy.
Here is a another look at the soaring U.S. debt:
Debt isn’t the only thing on the rise. Prices at the grocery and hardware stores are also soaring, making many Americans nervous. And, unlike in past years, the rising cost of goods is finally finding its way into the official data.
In April of 2021, the annual inflation rate soared in the U.S. to 4.2% – far exceeding the Federal Reserve’s 2% mandate and above all expectations. Trading Economics confirmed that,
“It is the highest reading since September of 2008, amid a surge in demand as the economy reopens, soaring commodity prices, supply constraints.”
United States Inflation Rate Soars in April
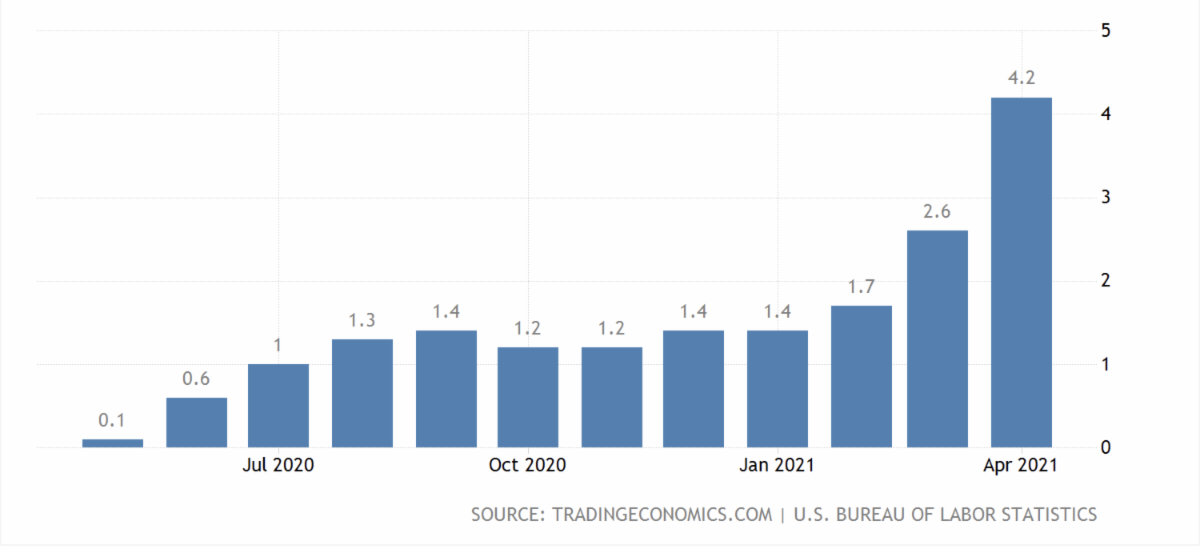
All eyes will be on May’s inflation data due out in the next few days. If it tops April, you can expect immense pressure on the Fed to raise rates post-haste.
Personal Consumption Expenditures (PCE) Price Index Soars
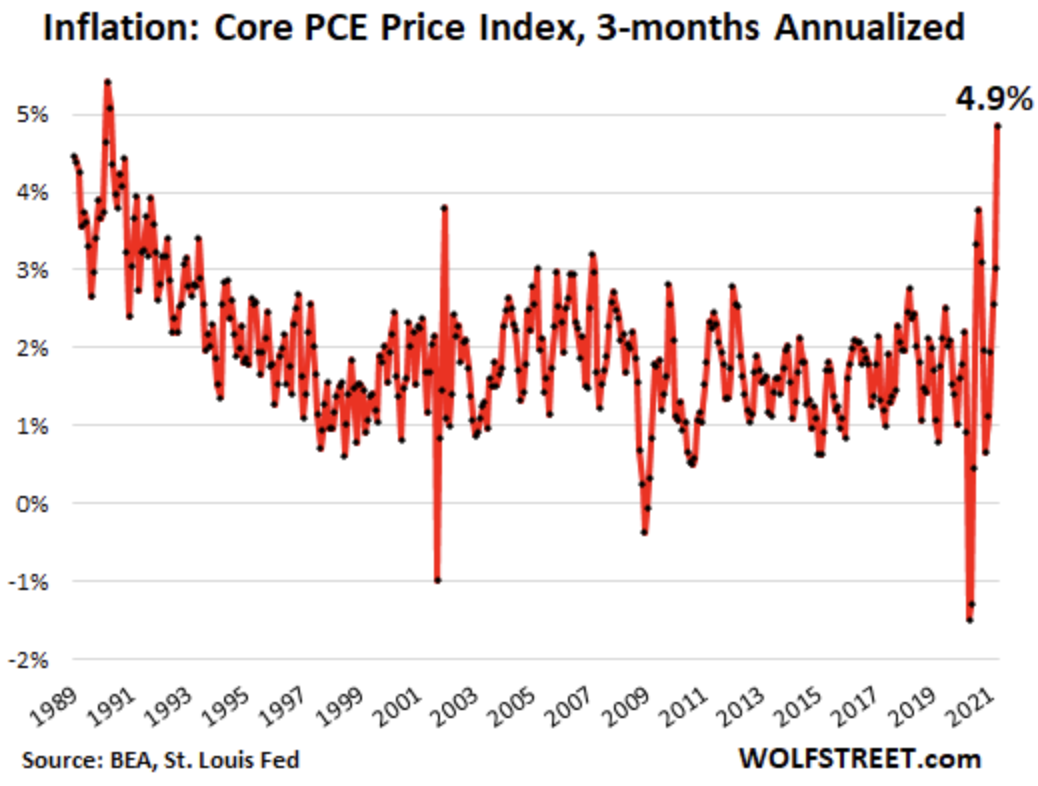
The Federal Reserve will often cite the PCE Price index because it does not include the ever-volatile costs of food and energy. On May 28, the Bureau of Economic Analysis reported that the “core PCE” index jumped by 0.7% in April from March, after increasing by 0.4% in March from February.
WolfStreet.com elaborates,
“Those two months combine into an annualized core PCE inflation rate of 6.4%, meaning that if price-increases continue for 12 months at the pace of the past two months, then the annual inflation would be 6.4% as measured by the lowest lowball measure the U.S. has.”
The articles goes on to say that,
“Over the past three months – so April, March, and February – the annualized increase of core PCE inflation was 4.9%, the highest since 1990.”
The chart below articulates the recent explosion in inflation in the U.S.:
Ballooning Rent and Used Car Prices
According to Zero Hedge and data from Apartment List,
“…after a period of decline, nationwide median rents just surged by the most on record as this key component of the CPI and PCE basket suddenly explodes higher.”
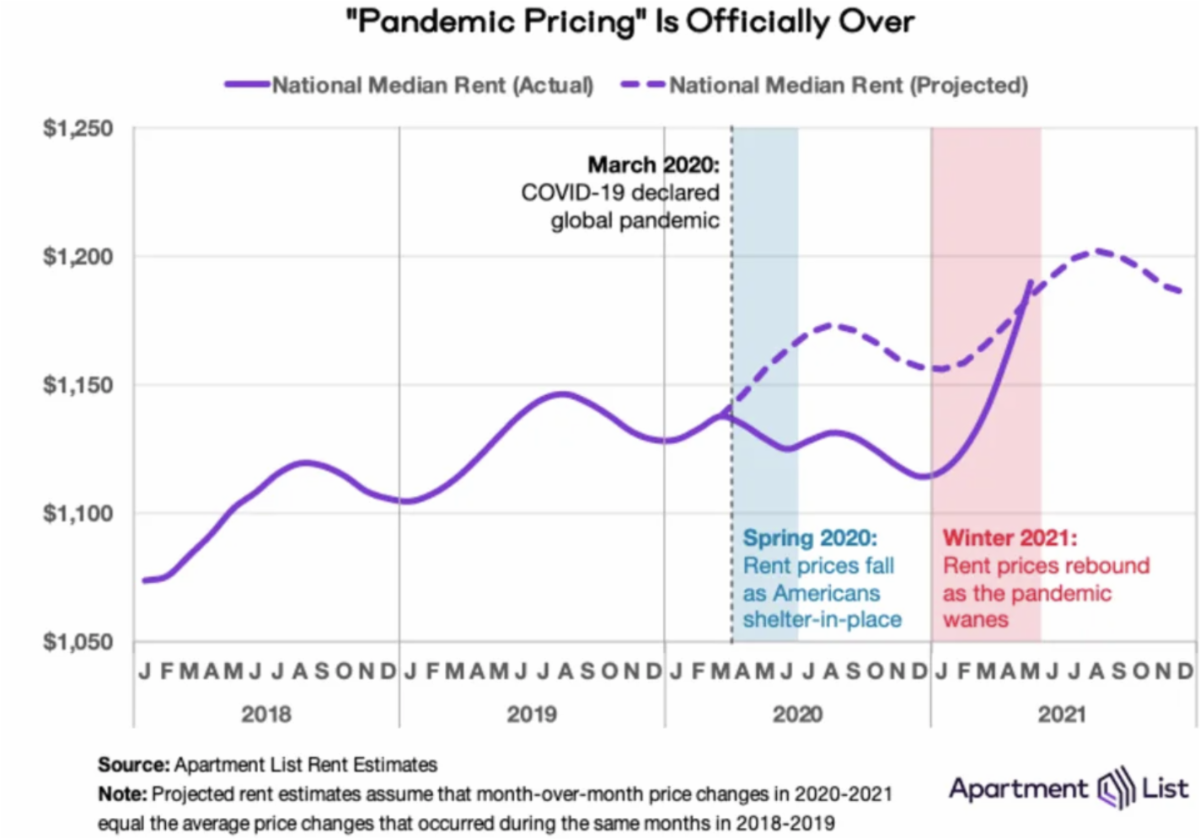
Although rents are in fact soaring, inflation is not the only reason for the price surge.
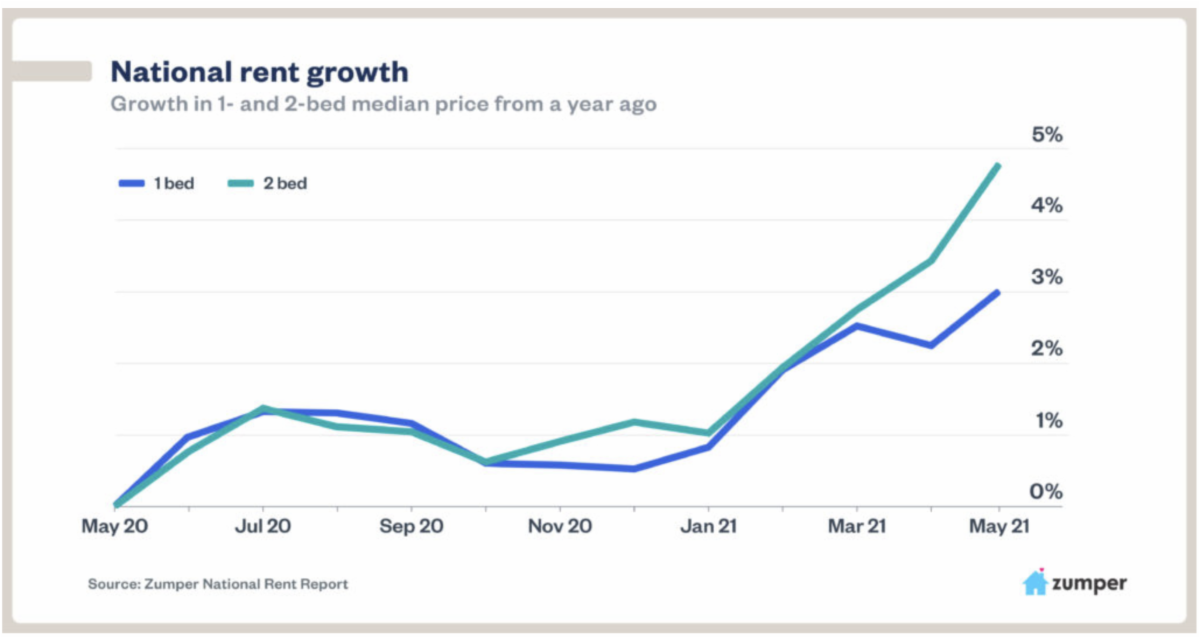
According to Zumper.com,
“The acceleration in rent growth nationally comes as expensive coastal markets are beginning to rebound while rent in cheaper cities remain flat. Of the eight most expensive cities, rent is down 16.3 percent since the beginning of the pandemic, up from January when rent was down 20.1 percent.”
Note: The median price of rent is soaring across the U.S. despite being off the pre-pandemic highs in many expensive cities.
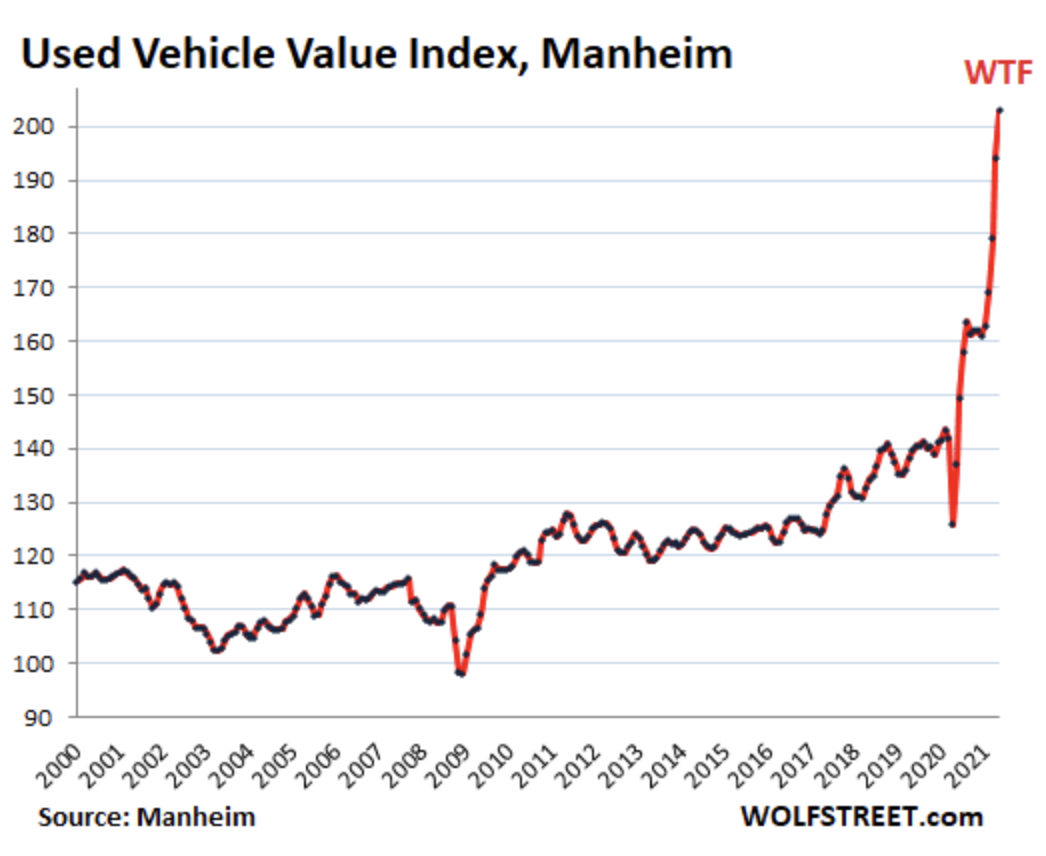
What about used Cars?
CBS News reports that,
“Across the U.S., used car prices in April rose to an average of nearly $25,500, according to J.D. Power. That’s the highest price ever recorded by the research firm, which began tracking used vehicle sales in the early 1980s. That price is up $3,650 — nearly 17% — since the beginning of 2021.”
Amazingly, used car prices soared 10% in April alone. And CBS News confirmed that,
“The Labor Department said that was the largest one-month jump in used car prices since it began tracking the data in 1953.”
Finally, according to WolfStreet.com,
“Prices of used vehicles that were sold at auctions around the U.S. through the first half of May spiked by 45% from May 2019, according to the Used Vehicle Value Index by Manheim, the largest auto auction operator in the U.S.”
As an aside, the rising cost of doing business and moving goods is becoming a global phenomenon. Take shipping costs from Asia to Europe, for example.
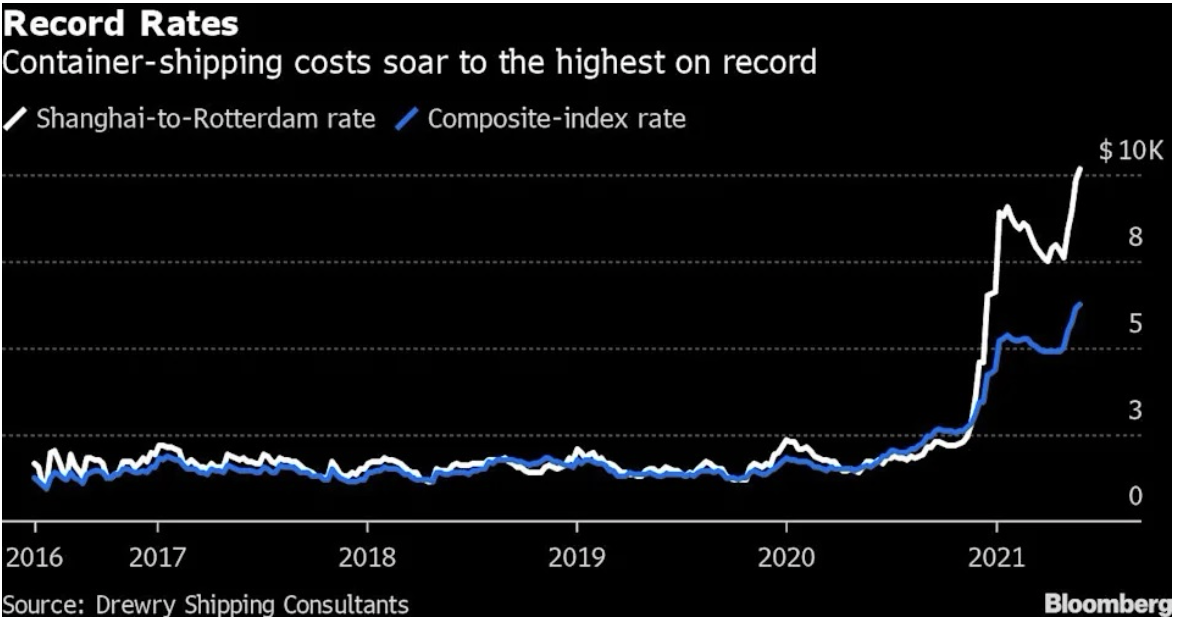
Note: According to BNNBloomberg, “The Drewry World Container Index released Thursday [May 27, 2021] showed the rate for a 40-foot container from Shanghai to Rotterdam rose to $10,174, up 3.1% from a week ago and a 485% jump from a year ago.”
Wrapping Up
While the U.S. government continues to print trillions, devaluing its currency to prop up social institutions and to “stimulate” the economy, the mindset of consumers is changing.
Consumers have now noticed today’s inflation, and they can also see it coming for their purchasing power tomorrow.
Meanwhile, the U.S. dollar continues to decline against a basket of global currencies and the ultimate money, gold. Inevitably, the Fed will soon face pressure to raise interest rates — putting the Biden Administration, and the United States as a whole, in a tough predicament.
So, with a devalued currency, massive deficits and rising inflation, it would seem the only politically acceptable way forward for the U.S. is to continue inflating away the debt. Unfortunately for America, that also means continual price increases for just about everything.
All the best with your investments,
PINNACLEDIGEST.COM