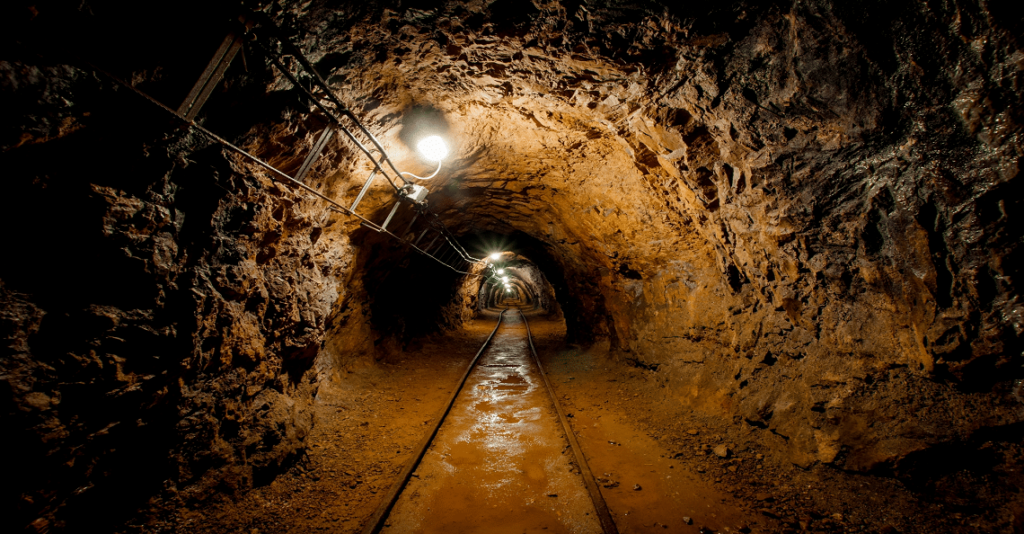
Since the discovery of electromagnetism in 1821, every technological breakthrough has depended on electricity. Following the invention of computers and the internet, electricity has become to economic progress what oxygen is to the brain. In the digital world, everything relies on electricity.
And today, by far the most widely used material to conduct electricity is copper.
Copper has been a highly valued metal since the Age of Antiquity. Previous generations found many uses for it, especially because of its durability and malleability. However, as the Copper Alliance put it:
“By far the greatest extension in the use of copper resulted from Michael Faraday’s discovery of electromagnetic induction in 1831 and the subsequent development of the electrical engineering industry, including the invention of the electrical telegraph in the early nineteenth century, which involved sending electrical signals along copper wire.”
Currently, the vast majority of copper produced (about 60%) is used in electrical wiring, while the remainder is used mainly in industrial machinery, roofing and in plumbing.
The Price of Copper Over the Years

Historically, the price of copper has risen during periods of monopoly, but especially during epochs of great technological advancement. From 1887 – 1889, French brass manufacturer, Pierre Secretan, who controlled 80% of the world’s copper supply, unilaterally triggered a 150% surge in the price of copper in one year.
Similarly, in an attempt to corner the copper market, the Amalgamated Copper Company, which held a controlling stake in Anaconda Mining (the world’s largest copper producer at the time), and in conjunction with other large copper producers, cut back its production and exports to Europe, forcing a huge increase in the price of copper between 1915 and 1916.
Nevertheless, the bigger spikes in the price of copper have come at times of significant industrialization and technological innovation… These periods had previously been sparked by wars (or the threat of one) that in turn led to a battle for technological supremacy. However, the reason behind the rally of the 2000s was a little different.
The 2000s
About 20 years ago, copper prices benefited from large-scale infrastructure developments in emerging markets (particularly China). A 2015 article from The New York Times quoted Edward L. Morse, Citigroup’s global head of commodities research, as saying,
“‘The last 20 years have been mind-boggling,’ Mr. Morse said. ‘Between 1993 and 2013, China built 200 cities of a million people or more. This was incredibly intensive in terms of steel and copper and other commodities.’”
Additionally, British investment management firm, Winton Group, spells out that,
“The typical eight-storey building uses around 20 tons of copper wire and pipes and China built thousands of such blocks during the 2000s. 1500 new cars, each containing 50lbs of copper, were hitting China’s roads each day. Millions of cell phones and PCs were sold in China, each containing ½oz and 1.5lbs of copper, respectively. Production struggled to keep up and inventories fell precipitously, triggering heavy speculative purchases.”
Another important event took place at the turn of the last century, in and around the aforementioned period when China created insatiable demand for copper…
In 1997, IBM cracked what was considered to be the holy grail for the semiconductor manufacturing process. They developed a way to use copper instead of aluminum – the industry standard at the time – in the conductive layer of microchips.
That enabled IBM to build faster, smaller and cheaper microprocessors — in a similar vein to what we wrote about last week, when we explained how palladium ended up replacing platinum as the metal of choice for catalytic converters. This switch to copper created additional demand for the metal in an industry that was already beginning to experience exponential growth.
With all the technological and industrial needs, demand for copper went through the roof in the 2000s, sending the metal to its highest price in about four decades.
Today’s Copper Boom
The surge in copper’s price lasted until the market crash of 2008 when the industrial metal — and a host of other commodities — were sent back down to earth. But, as illustrated in the chart below, it was only a matter of months before prices were back up and running again.
Copper Price – 45 Year Historical Chart
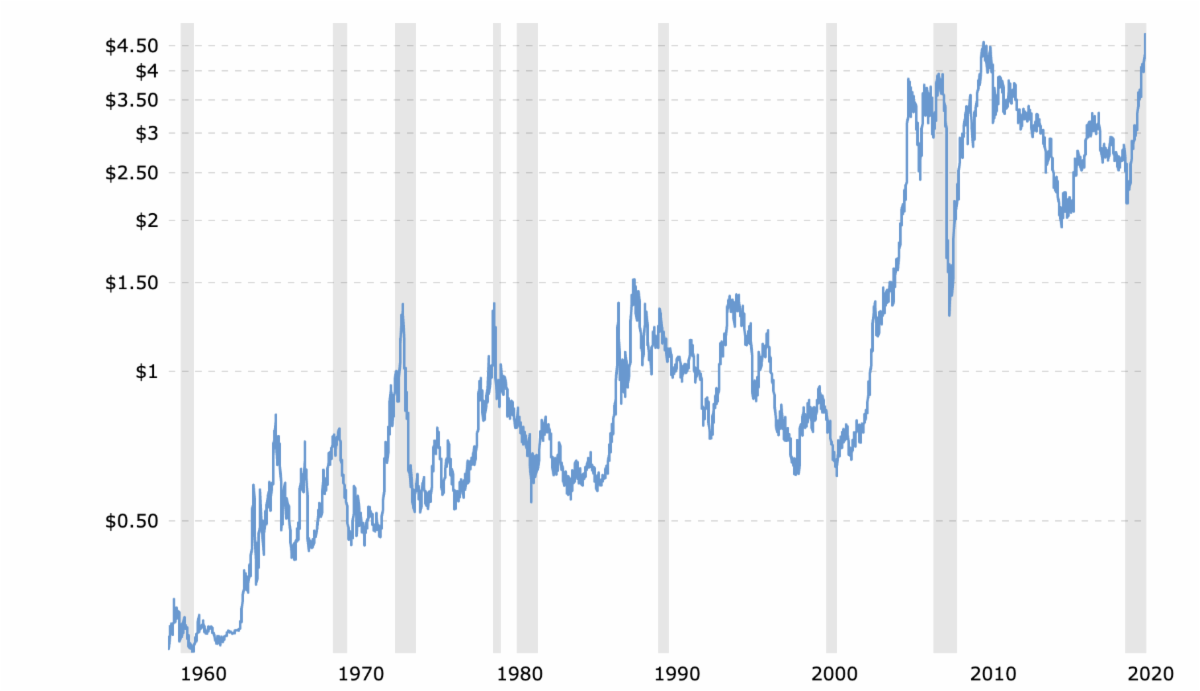
After the peak of 2011, the price of copper declined steadily for 5 years but picked up again in 2016, probably boosted by news of the Paris Agreement and its implication for the future of electric vehicles.
But notice that even then, prices remained range-bound for about 4 years until 2020, when the price of copper went gangbusters…
Here is a closer look.
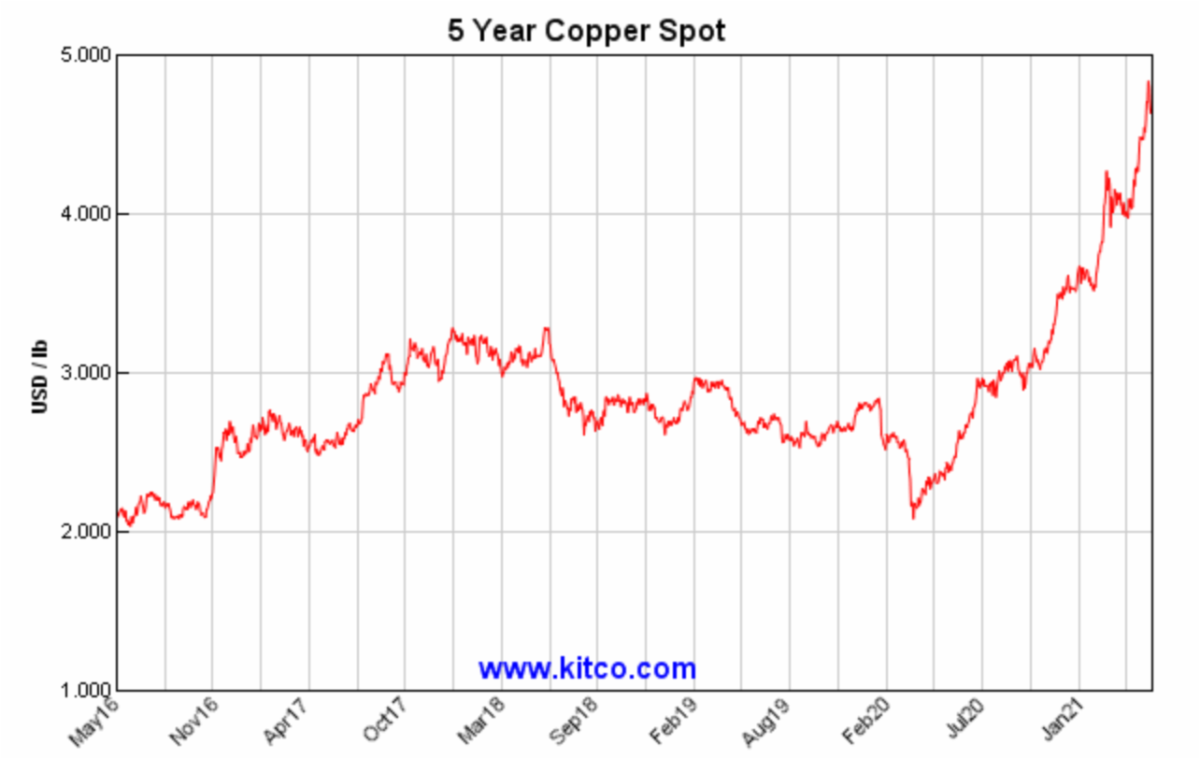
So, what is the breakout to new all-time highs in copper all about?
In March of 2020, the International Copper Association (ICA) — comprised of the world’s largest copper producers, refiners and fabricators — put out a press release alerting the market that:
“Under a scenario where global energy consumption reduces by three percent annually, copper demand would experience a cumulative increase of 17,672 Kt over ten years against a base level, according to a study by Navigant/Guidehouse Research.”
The release goes on to say that,
“Based on the activity of the Three Percent Club, a collaboration of governments and supporting organizations that commit to working together to put the world on a path to three percent annual efficiency improvement…In the three percent scenario, demand would increase at an 11.8 percent compound annual growth rate (CAGR) in the transport sector.”
The Statista chart below shows global copper production levels in the last 15 years.
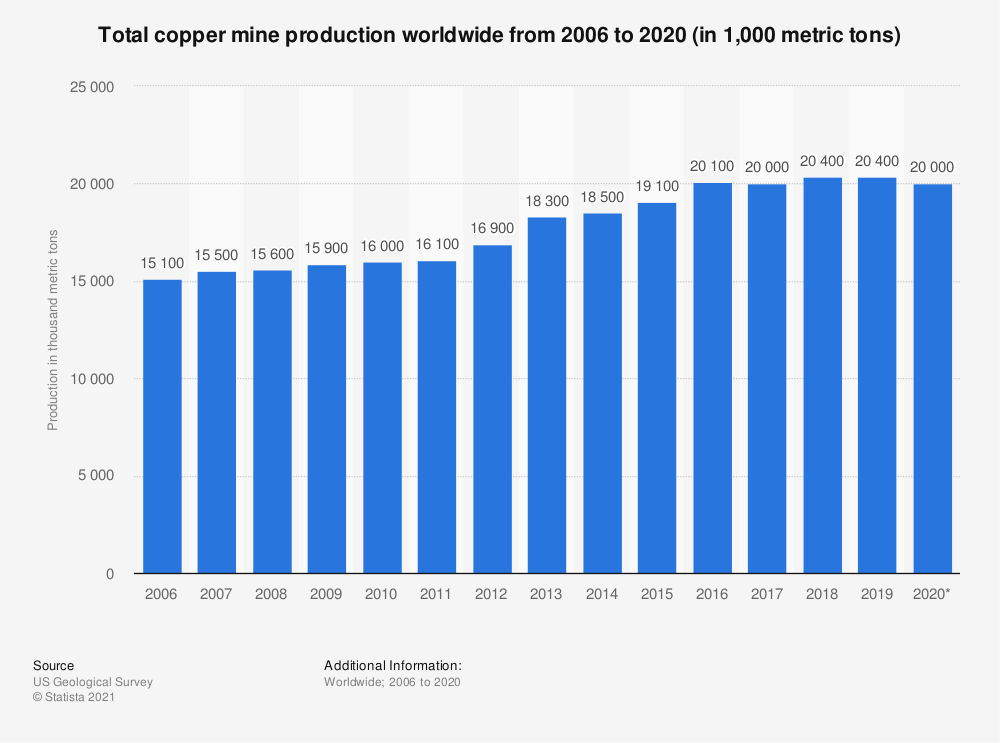
From 2006 – 2020, the cumulative increase in copper produced worldwide was about 5,000Kt. The highest annual rate of increase in the last 15 years was between 2012 and 2013, when global production jumped roughly 8%. And for the last 5 years, copper production has remained relatively flat, except for in 2020…
Global mine output for 2020 dropped substantially due to the pandemic, resulting in demand significantly outweighing supply…
So, it makes sense that in March of 2020 the metal’s price began to surge. Earlier this month, it hit a new nominal all-time high. Can it continue?
Predicting Copper Price’s Future
Two weeks ago, the International Copper Study Group (ICSG) released its copper market forecast for 2021/2022. Their projections indicate a surplus of about 80Kt for 2021 and 110Kt for 2022. See the table below for highlights.
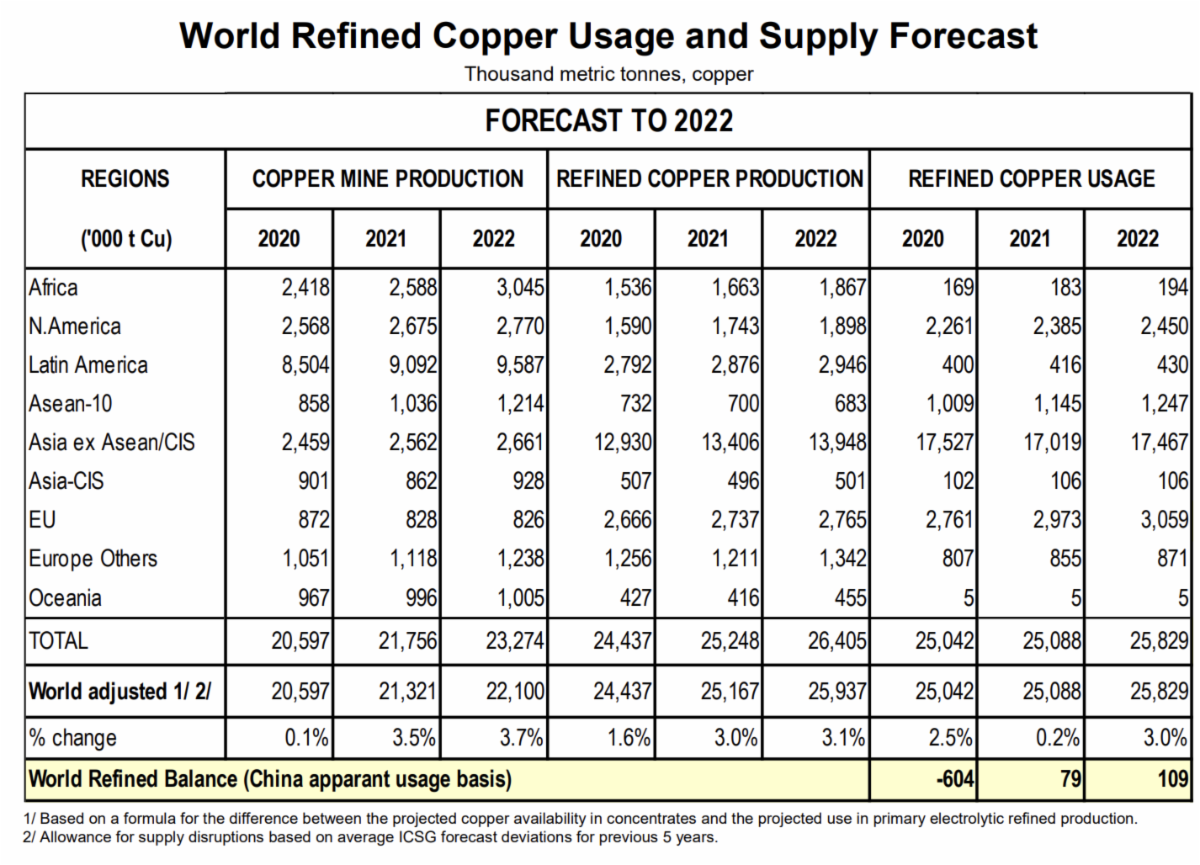
The massive fluctuation in World Refined Balance between 2020 and 2021 boils down to demand from China.
According to the ICSG, the 604Kt deficit of 2020 was largely due to a sharp increase in Chinese refined copper usage. In 2021, they expect the Chinese to import significantly less refined copper. The ICSG’s forecast shows about a 7% increase in global usage of refined copper (excluding China), but roughly a 4.5% decrease in Chinese refined copper usage.
The Statista chart below gives an idea of China’s influence over the copper market.
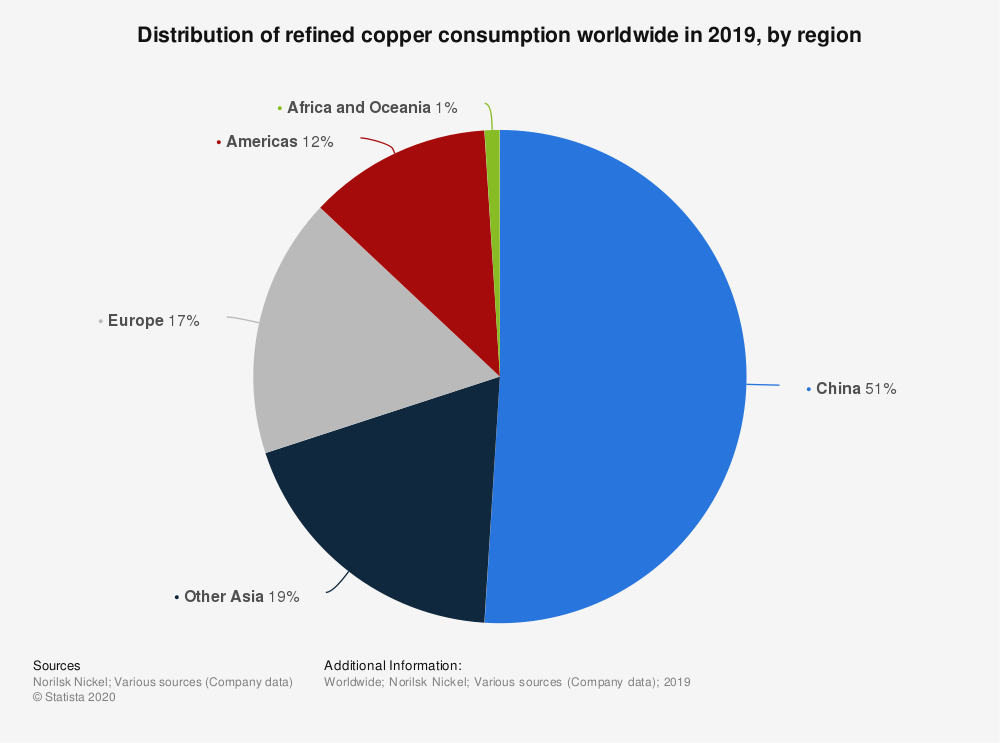
In 2019, China accounted for more than half of global consumption of refined copper.
The ICSG is also predicting an even greater surplus for 2022 for the following reasons (among others):
- Post-pandemic economic recovery
- Ramped up output from recently commissioned mines and new major projects starting this year
- Additional output from mines that opened in previous years.
Unlike palladium and other PGMs, copper is fairly ubiquitous globally. The Statista chart below shows the total spread of copper deposits worldwide:
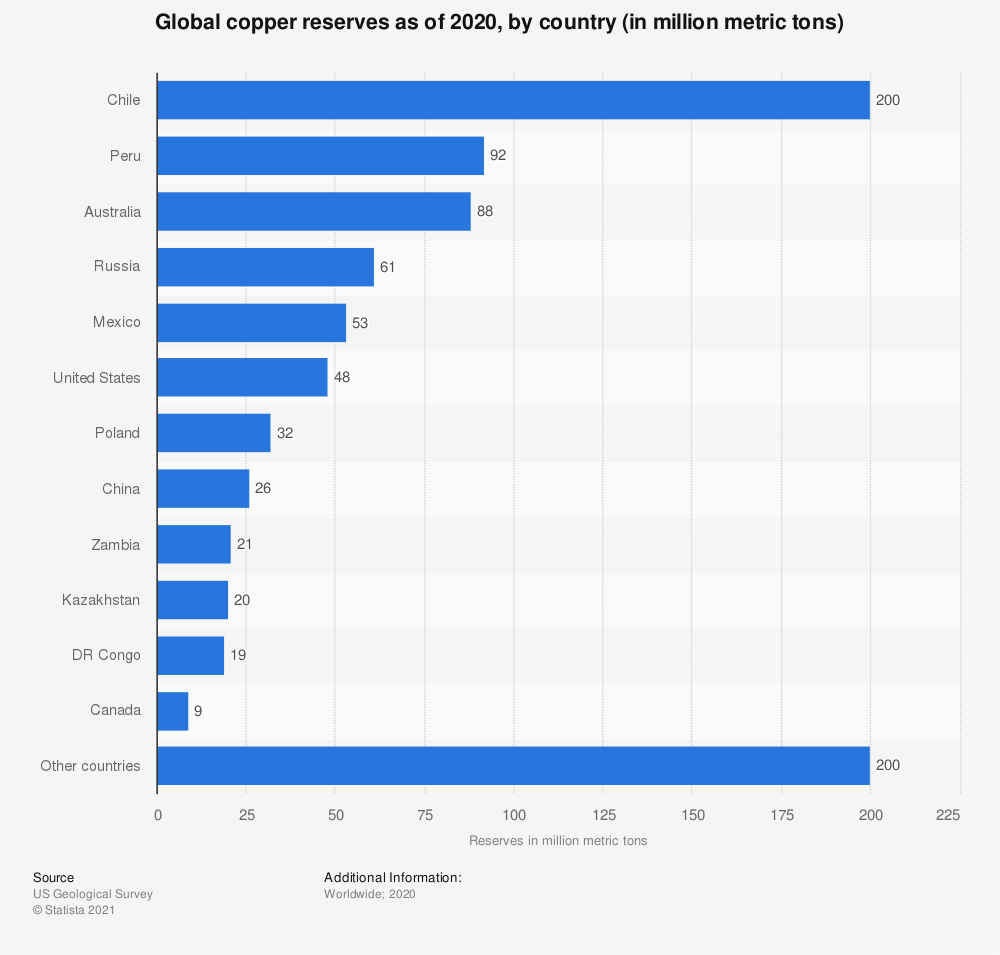
Evidently, Chile sits on the lion’s share of copper in the world, but that only accounts for about 20% of global reserves. And as of 2019, Chile was responsible for roughly 30% of all the copper produced worldwide.
In February of this year, Mining.com reported that,
“According to the (United States Geological Survey) USGS, roughly 700 million tonnes of copper have been produced around the world so far, while identified deposits contain an estimated 2.1 billion tonnes of additional copper that have yet to be mined.”
Several new projects are already underway to explore the potential of mining some of the earth’s untapped copper resources. Mining Intelligence lists out the top 10 copper projects according to resources in the measured and indicated categories.
Mining Intelligence’s Top 10 Copper Projects
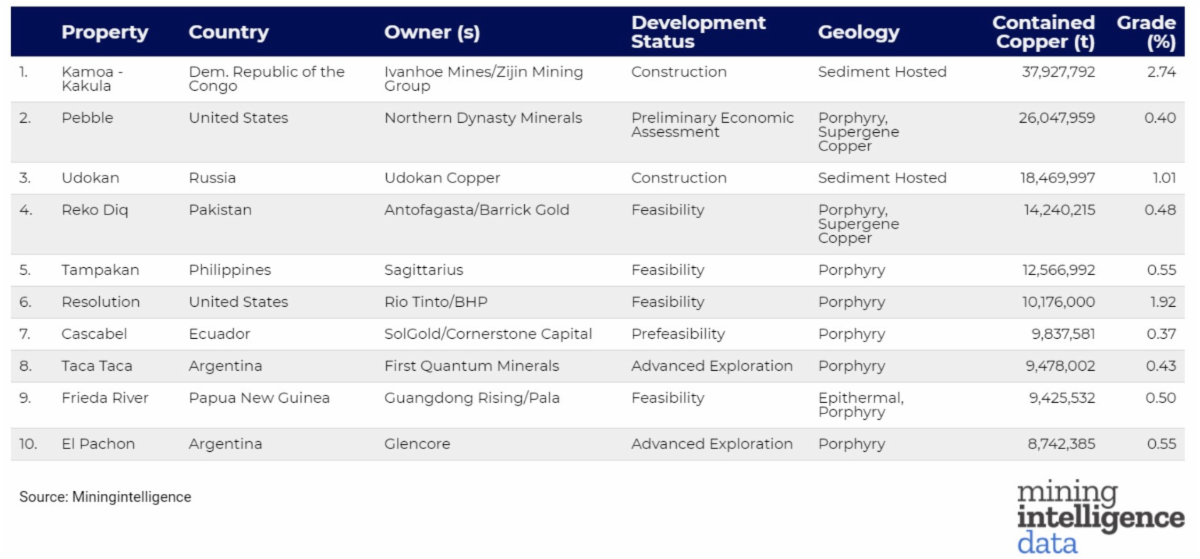
It’s worth noting that none of these projects reside in Chile, the world’s pre-eminent copper producing nation.
The Ivanhoe/Zijn Kamoa-Kakula project in the Democratic Republic of Congo is projected to produce (at its peak projection level – various phases of development involved) more than 800,000 tonnes of copper per year. That would make it the world’s second-largest copper mine…
The company announced that the target date for C4 commissioning (milling of ore and first copper concentrate production) has been advanced to the end of May or early June this year – several months ahead of schedule.
Regarding output from existing mines, the ICSG Directory of Copper Mines and Plants confirmed that due to operational constraints as a result of the pandemic, the global mine capacity utilization rate declined to 82.3% last year. The previous five years saw an average mine capacity utilization rate of around 85.5%. And as things return to normal, the capacity utilization rates going forward are expected to rise to previous levels.
Furthermore, in their press release from March 10th of this year, the ICSG forecasted that,
“Over the period 2021 to 2024, world mine capacity is expected to increase by an average of 4% per year”
So, with massive new projects rolling out soon, mine capacity utilization rates expected to return to or surpass the previous average, increased copper recycling capabilities, and a sustained annual increase in mine capacity, copper production seems relatively well-placed to meet the growing industry demand, at least for the foreseeable future.
Copper Price Surge to Peak in 2021
A surge in copper prices is an indicator of industrialization and economic growth. It is, after all, known as Dr. Copper for a reason.
For the better part of the last two decades, the market has seen increased demand for copper thanks in large part to major technological breakthroughs and developments in emerging markets, led by China.
That said, with new copper mining projects coming to life, and copper producers ramping up output for existing mines at higher utilization rates from last year, the forecasted copper surplus makes us believe that its price surge will peak towards the end of this year.
All the best with your investments.
PINNACLEDIGEST.COM
If you’re not already a member of our newsletter and you invest in TSX Venture and CSE stocks, what are you waiting for? Subscribe today. Only our best content will land in your inbox.