In today’s world of record monetary stimulus and inconceivable deficits, investors are rushing to the safety of gold. Gold producers, including Barrick Gold and Kinross Gold hit 52-week highs this past week.
The extreme monetary and fiscal measures recently enacted by the Federal Reserve and U.S. government are fuelling demand for an alternative to the U.S. dollar. Many fear the Fed may have finally gone too far.
Fed Balance Sheet Goes Vertical, Exceeding $6 Trillion
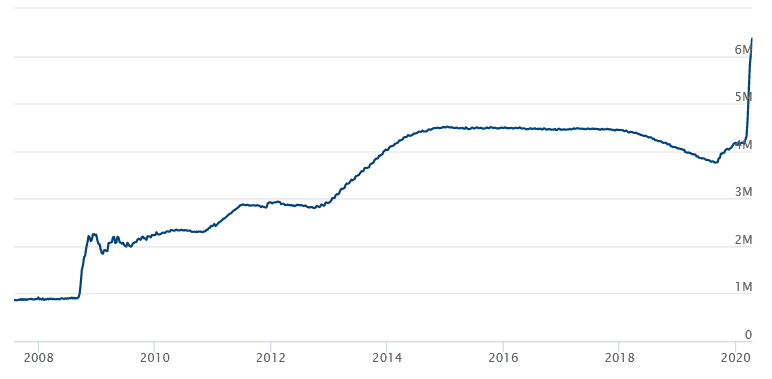
The monetary experiment we are witnessing today goes far beyond anything we saw following the Great Recession of 2008-2009. In this environment, where the U.S. alone has committed to more than $8 trillion in aid to fight the Covid-19 economic crisis, investors are bearish on the U.S. dollar’s future value.
As a result, historic liquidity has flooded the gold market in a bid to diversify away from the U.S. dollar.
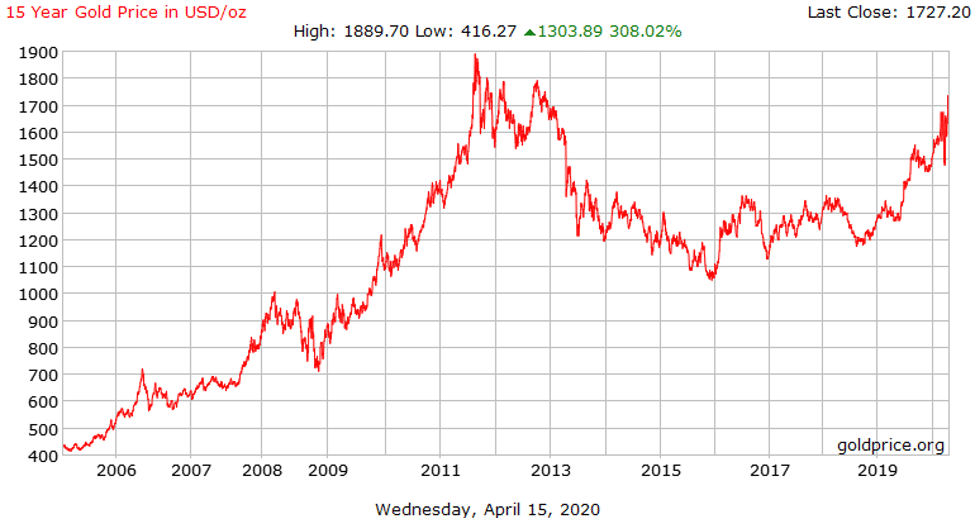
A few weeks back, we outlined this phenomenon in a Weekly Intelligence Newsletter titled, Record Stimulus and Deficits to Drive Gold in 2020. This past week, gold hit a 7-year high, nearly breaching US$1,750 an ounce.
Gold Trades Above $1,700 – 15-Year Chart
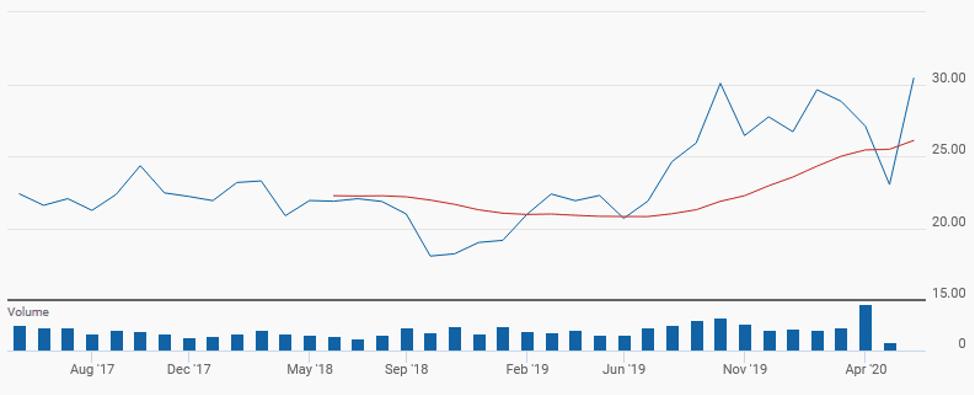
Gold Producers Soar as (GDX) Hits Multi-Year High of $32.28 on April 14th
According to the World Gold Council,
“Global gold-backed ETFs (gold ETFs) and similar products added 298 tonnes, or net inflow of US$23 billion, across all regions in the first quarter of 2020 – the highest quarterly amount ever in absolute U.S. dollar terms…”
Blackrock iShares Gold Trust (IAU) – 1 Year Chart
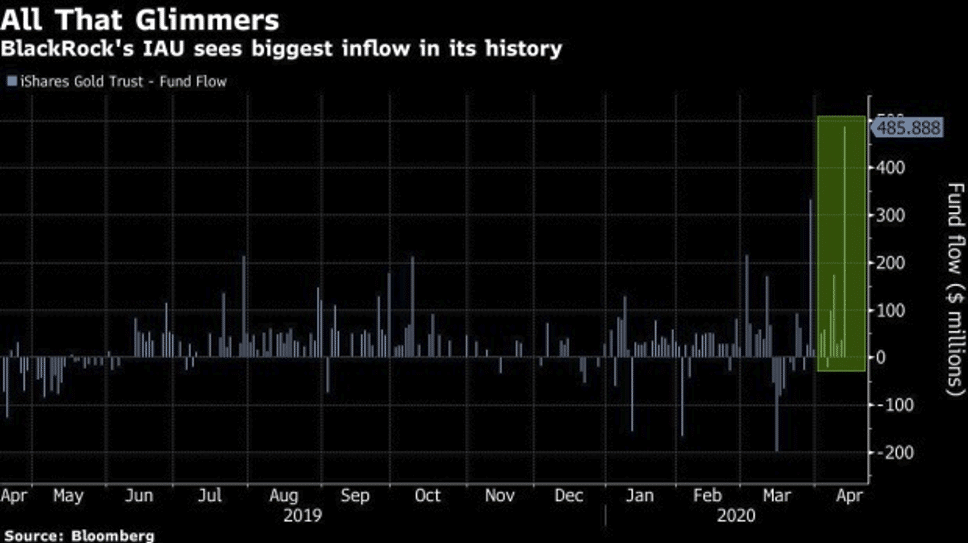
“BlackRock’s iShares Gold Trust, ticker IAU, took in $486 million on Tuesday, its largest one-day inflow on record.”
And,
“State Street’s SPDR Gold Shares, or GLD, has seen 10 straight days of inflows totaling about $2.9 billion.”
James Pillow, managing director at Moors & Cabot Inc., sums it up perfectly,
“With the global amount of central bank money printing, there is a innate drive to acquire the oldest currency in the world – gold.”
Amid this chaotic rush to gold and gold producers, let us remember why investors often choose the precious metal to protect their wealth.
A Stable Money Supply
The answer to ‘why gold?’ lies in its autonomy from policymakers and the predictability of its supply.
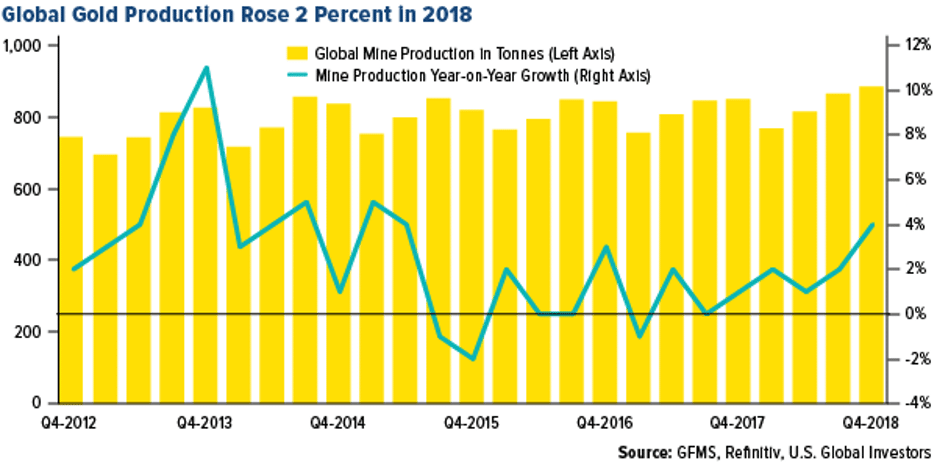
Excluding a few epic gold discoveries such as Witwatersrand in South Africa (1886) and the California Gold Rush (1848), gold’s rate of supply has remained relatively stable, expanding at approximately 1.5 – 2.5% annually in recent years. Gold producers cannot quickly increase their output.
Gold Production Remains Remarkably Stable
Gold Buoyed by Real Interest Rates
Let’s exclude the global money supply’s multi-trillion-dollar expansion for a moment, and just focus on real interest rates.
Given that gold doesn’t yield interest, it must compete with interest-bearing assets. This is why many market commentators believe rising interest rates detract from gold’s appeal.
However, real interest rates across much of the Western world are negative… and will be for some time.
The U.S. is simply unable to raise interest rates without adding trillions in future interest payments. Even at today’s depressed rates, the U.S. is still paying hundreds of billions in interest every year.
With interest rates near zero for the foreseeable future, and inflation at 1.5%, currencies are effectively losing purchasing power every day. In theory, investors can mitigate this erosion of purchasing power by diversifying into mediums of exchange that have a limited supply growth rate (i.e. gold).
In The Bitcoin Standard: The Decentralized Alternative to Central Banking, Saifedean Ammous explains,
“The problem with government-provided money is that its hardness depends entirely on the ability of those in charge to not inflate its supply.”
Historic National Debt
In early 2019, when the U.S. national debt stood at roughly $22 trillion, every U.S. citizen (babies included) owed roughly $67,000. With national debt now above $24 trillion, and likely going to $30 trillion in the next 5 years, the amount owed by U.S. citizens will grow…
By the end of 2020, the national debt will exceed the size of U.S. GDP for the first time since World War II.
Analysis by the Committee for a Responsible Federal Budget (CRFB) forecasted,
“…the deficit for fiscal 2020 will exceed $3.8 trillion, more than 2.5 times the record set during the Great Recession.”
What we find so disconcerting about the projected $3.8 trillion deficit is that the economy will likely be contracting at the same time.
According to TradingEconomics.com,
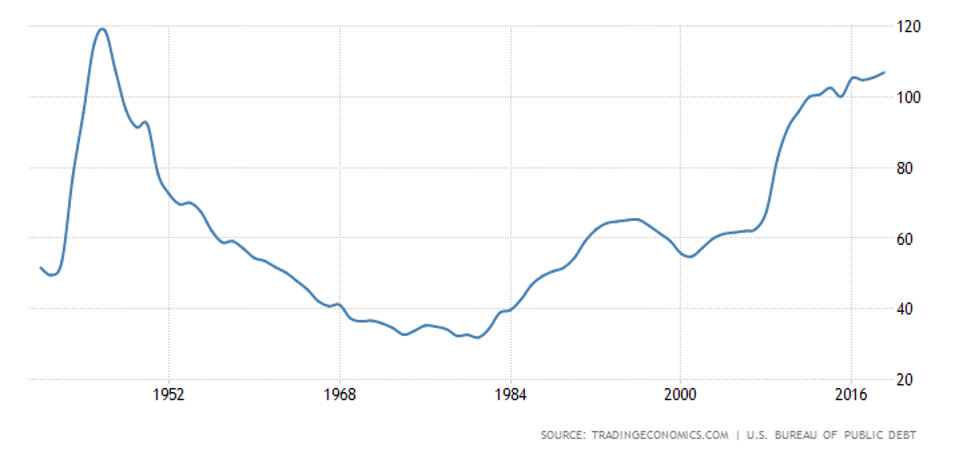
“The United States recorded a government debt equivalent to 106.90 percent of the country’s Gross Domestic Product in 2019.”
The United States’ highest ever debt to GDP ratio was 118.60%, which occurred in 1946 following the end of WWII. We are predicting the U.S. debt to GDP ratio will exceed 115% by the end of 2020 and reach a new record in 2021, as the U.S. economy fails to recover strongly and debt continues to pile on.
U.S. Debt to GDP to Surpass 120% by 2021
The threat of rising debt to GDP levels is far more impactful to the everyday citizen than many economists suggest.
According to Just Facts, in the 40 years following the end of World War II (1946–1985),
“…federal spending as a portion of GDP fell by 50% within two years and averaged 41% lower than the last year of the war during this period…”
And that,
“…the national debt as a portion of GDP declined by 76 percentage points.”
Does anyone really believe the U.S. will suddenly be able to tighten its belt and reduce runaway spending? President Trump ran a near $1 trillion deficit last year in what was considered a booming modern-day economy.
Equally difficult to imagine is the U.S. experiencing the growth it did in the 1950s and 1960s that enabled it to pay down its debt. For two decades during the 1950s and 60s, U.S. GDP enjoyed average growth above 4%. While 4% growth isn’t impossible, averaging it over the next 20 years is unrealistic given the current economic climate.
What’s more, during the 1950s, America had higher income tax rates than today’s. For example, the top marginal income tax rate in America was 91% in the 1950s. While this is a topic for another Intelligence Newsletter, just know that higher income tax rates, as well other forms of increased taxation, are inevitable… We will have to pay for the Covid-19 Crisis at some point.
Billions Flow into Gold and Gold Stocks as Faith in U.S. Dollar Wanes
Billions of U.S. dollars are moving into gold, gold producers, and gold-backed ETFs. Faith in both the U.S. dollar and its policymakers is waning. With fear surrounding rising debt and a massive increase in the money supply, investors are turning towards stores of value with predictable supply.
This rush to gold may present a massive opportunity for TSX Venture investors and speculators in Canada’s small-cap market.
Many senior gold producers are now trading at record highs. Although it typically takes a year or two for this money to trickle down to the juniors, the gains among mining explorers could be explosive — especially if gold breaches US$2,000…
The Covid-19 Crisis has become another huge catalyst for gold and gold stocks, namely large gold producers to date. In the short-term, expect significant volatility in gold’s price. However, it is our strong belief that over the next 18-24 months, gold will remain in a bullish trend.
All the best with your investments,
PINNACLEDIGEST.COM
If you’re not already a member of our newsletter and you invest in TSX Venture and CSE stocks, what are you waiting for? Subscribe today. Only our best content will land in your inbox.