Copper prices have had a strong run. Starting around June of this year, we have seen the price of copper, react to falling copper supply. Hence, copper’s price has increased more than $0.50 to the current price above $3 per pound. Copper hit a fresh 6-month high this morning of $3.219.
However, from a technical trader standpoint we are getting nervous. This article was written last week at a time when the price action had begun to weaken. There are a few reasons for that which we will explain shortly.
But, before getting into why the price action is weakening, let’s touch on something we’ve noticed in the past few weeks when talking to new commodity traders. The common thread I hear is that these traders do not have a solid understanding of what moves copper prices. Without that understanding, trying to determine how to trade copper will likely be fruitless. At the heart of it, copper prices are driven by supply and demand. However, copper trading in Canada requires a deeper understanding. Just look at the volatility in the 45-year copper chart below. Without considering all the factors that drive commodity prices, there is no way to sense of the price action let alone make an educated guess on the direction of the price.

So, before I explain why I think copper prices are looking unstable from a technical trading perspective, let’s do a quick refresher on what drives copper prices.
Fundamentals of Copper Pricing
New traders rarely understand the concept of supply and demand. However, in contrast to investing in the stock market which is inherently simple when compared to commodities, several factors affect this supply and demand. Here is a reminder of what copper traders in Canada should constantly try to understand.
Copper Supply | Dependent Upon Two Methods
Copper supply is dependent on one of two methods. The first is the production of new copper from new or existing copper mines. The production volume from these mines and the pure number of mines that are producing can greatly impact copper prices. Chile is the world’s largest producer, followed by China and then the United States. Stalled production at even a single mine, if large enough, can send the price of copper significantly higher.
The second generator of supply is copper alloy scrap. This constitutes copper obtained from scrap metal operations that break down old equipment into the component parts, of which a key one is often copper. Canada is one of the world’s largest exporters of copper scrap and are can greatly influence the balance of copper supply in the world market. If either of these supply networks becomes distributed, supply can be severely limited which impacts price.
These disruptions can come from many events including labour strikes at mines, earthquakes, political unrest in producing countries, and even shipping problems; all of these factors may limit the ability of producers to get product to market.
Copper Demand | The Other Side of the Coin
The other side of the copper equation is demand. The more people and countries which need copper, the higher the demand. That increased demand tends to drive copper prices higher. For copper traders, creating a solid forecast of copper demand is critical to understanding what the price might do in the future. In the past ten years, the primary driver for the increase in copper prices is the growth of Asian populations like China. With copper used in everything from computers to cars, the demand growth of the Chinese economy has placed huge pressure on copper supply.
Copper Supply Inventory
Copper supply is stored as inventory, and the balance of this inventory is also another fundamental factor that impacts copper prices. When inventory is high, that typically means demand is down and supply is up, which can drop prices. When inventory is low, obviously that is typically good for prices as it indicates demand is high and the supply chain is having trouble keeping up. The balance of these inventory levels is a key factor copper traders spend a lot of time evaluating.
Copper’s Current Price Action
Even with all the fundamental elements above to consider, trading with the predominant price trend of each commodity is usually best. One must work hard to understand what is going on in the copper market to understand what is happening, however price trends are also key.
Most investors will find they are not very good at trading against the trend. When it comes to my trading style, I go with the predominant flow.
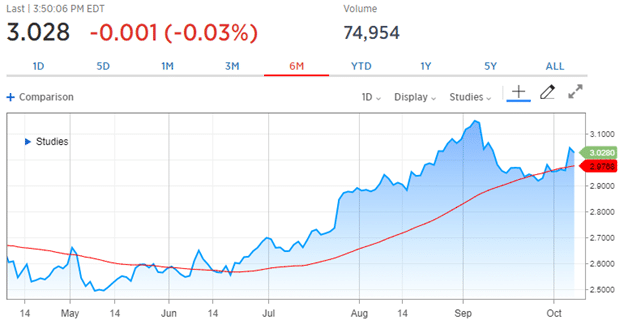
For this reason, we are worried about the price of copper right now. One of the simplest, and frankly most effective tools to use is the 50-day moving average. With the 50-day moving average we can see a positive trend starting to form, as well as track the strength of that trend day to day. Also, we can see when an uptrend is breaking down.
Look at this six-month chart for copper, with the red line indicating the 50-day moving average:
Copper Price | Watch the Moving Average Line
When trading a moving average, a trader looks to open a position when the commodity price closes above that moving average line. A strong uptrend is in place when the price of the commodity remains above the moving average line.
As long as the share price stays above the moving average line, and that line is moving upwards from left to right, an uptrend is in place. A trend follower will then hold on to the position until the moving average line breaks to the downside.
In the case of copper, the price had been in a strong uptrend since the end of June. Many factors had helped that including increasing demand from China. However, since September things have started to break down and we even saw the price of copper breach the 50-day moving average line. As a trend follower, this has me worried as the trend is in jeopardy.
Copper Price Fundamentals | What to Look for in the Next Few Weeks
To continue this strong copper trend, copper traders in Canada will be looking for further indication that demand in China remains strong; also, that supply is balanced and not getting too far ahead of itself. Finally, like all commodities, the U.S. economy continuing to fire on all cylinders is critical.
From a purely technical perspective, we will be watching what copper prices do related to the 50-day moving average. We will want to see the 50-day line continue to be pointed up, and copper prices staying above the line.
Look at the most recent one-month chart, things are still looking good, however copper prices are having trouble picking a direction. If that blue line drops below the red line, and that red line starts to point down, then there may be lower prices on the horizon. We are watching that closely, and will likely be a seller if that happens.
Nothing is for certain, however using indicators like the moving average can help traders determine what may be coming. Coupling that with a solid understanding of the fundamental elements that drive copper prices, we can trade what is happening in the market versus what we think may happen.