Legalization and social acceptance have been critical to the performance of the cannabis market. Over the last five years, the Canadian Marijuana Index (CMI) has enjoyed great bull markets, followed by some devastating bear markets.
From a 52-week high of 559.70 in February, the CMI dropped to its current level of approximately 170 points. The high came amidst constant retail demand increase, aided in part by the pandemic. Volatility is the norm for this index and the pandemic was no exception. Let’s take a look at the index’s previous bull and bear markets.
A Look at The Canadian Marijuana Index
The Canadian Marijuana Index was relatively flat until July 2016. Then, centered around the news and the anticipation of legalizing cannabis across Canada, the CMI entered its first bull market, soaring about 300% in four months.
When the Bill to legalize marijuana was introduced in Canada, the CMI rapidly increased in value, reaching an all-time high of roughly 973 points by January of 2018.
Canadian Marijuana Index
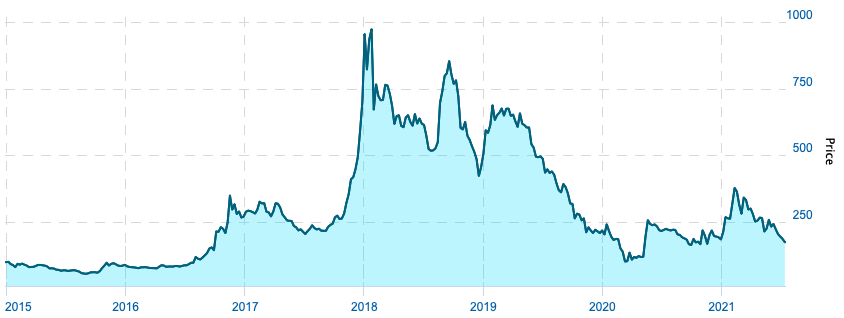
From what investors hoped would be a promising 2018 and 2019 for the marijuana industry, a bear market quickly developed, but then rebounded shortly thereafter, sending the index back to within 150 points of its all-time high.
Bull vs. Bear Markets in Canada’s Cannabis Sector
Price discovery is always a factor in any market, but in a young one where policy changes constantly, volatility is often exaggerated.
The Canadian Marijuana Index has already experienced six bull markets and six bear markets in less than six years!
On average, each bull market persisted for about four months with a rebound rate of ~181%. Conversely, on average, bear markets have had a duration of roughly seven months and a declining rate of ~52%.
Interestingly enough, the Canadian Marijuana Index consists of bear markets outlasting the bulls by nearly double the duration – quite the opposite of what’s commonly seen in bull/bear markets.
Hartford Funds expands on this idea,
“Bear markets tend to be short-lived. The average length of a bear market is 289 days, or about 9.6 months. That’s significantly shorter than the average length of a bull market, which is 973 days or 2.7 years.”
The Canadian Marijuana Index and the CSE
As the Cannabis sector weakens in today’s bear market, valuations and exchanges are feeling the impact of this. The Canadian Securities Exchange offers a wide range of cannabis stocks. Of the 690 companies that trade on the CSE, 186 are marijuana-related.
CSE Composite Index: 5-Year Chart
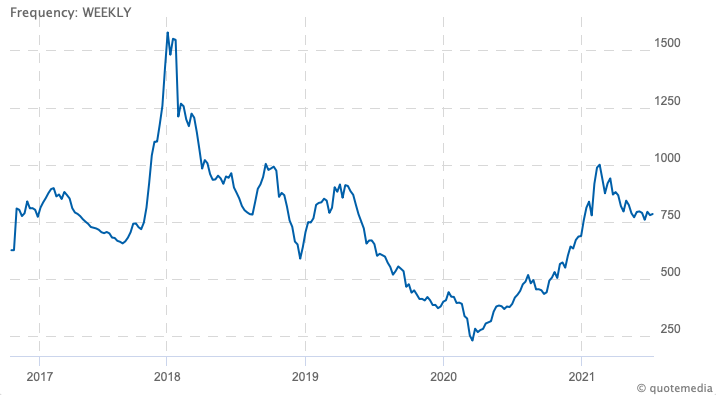
Notice the stark similarities between the 5-year charts of the CSE Composite Index and the Canadian Marijuana Index.
Moving Forward
The Canadian Marijuana Index has been volatile from the beginning and is currently witnessing a severe decline, falling from 228 on June 24th to today’s low of 170. If history is any indicator, the cannabis sector could be re-entering a bull market sometime this July. It would not surprise us to see seasonality factors kick in, thereby shifting momentum and triggering valuations to climb, both in the Canadian Marijuana Index and on the CSE.