The United States, currently enjoying its longest bull market in history, is decoupling from the rest of the world. From its currency to its stock market, the US is on demand. Despite somewhat underwhelming US growth in 2019 (2.1% GDP), investors continue to bid up America’s leading companies, the likes of which include Amazon, Google, Apple, Netflix and Tesla. Major US indices are in the midst of the longest bull market in American history. All of them sit at or near record highs while the US Dollar Index remains strong (the index closed at 99.16 as of this Friday). Amidst last week’s strong rebound in US stocks, Fed Chair Jerome Powell warned that $1 trillion budget deficits were unsustainable, and that adverse effects from the coronavirus on the US economy were ‘very likely.’ The market shrugged off his warning.
Four Factors Driving Longest Bull Market in U.S. History
For the US stock market, it all comes down to the consumer and the Fed. Here are the four factors driving this historic bull market:
- a strong labour market (payrolls expanded by 225,000 in January, topping estimates)
- climbing wage growth (averaging between 3.5-4% since mid-2018 – the highest in a decade)
- US household debt to GDP ratio declining from 98% in 2008 to 75% in 2019
- Last but not least, a Fed that has shown willingness to slash rates and inject tens of billions worth of stimulus per month to keep the US economy on track
Given the aforementioned factors, it appears the longest bull market and economic expansion in US history will press on through 2020. However, we can’t help but notice two looming threats to this seemingly endless market rally…
GDP Growth Slows in EU and China
Declining growth and rising debt in the EU and China pose a significant threat to the longest bull market in U.S. history – a nearly 11-year rally. First, let’s take a look at Europe. Not only is the Eurozone home to an aging population, but it continues to struggle with declining growth (EU GDP has been falling since late 2017, dropping as low as 1.1% in Q4 2019) and high debt loads.
European Union GDP Annual Growth Rate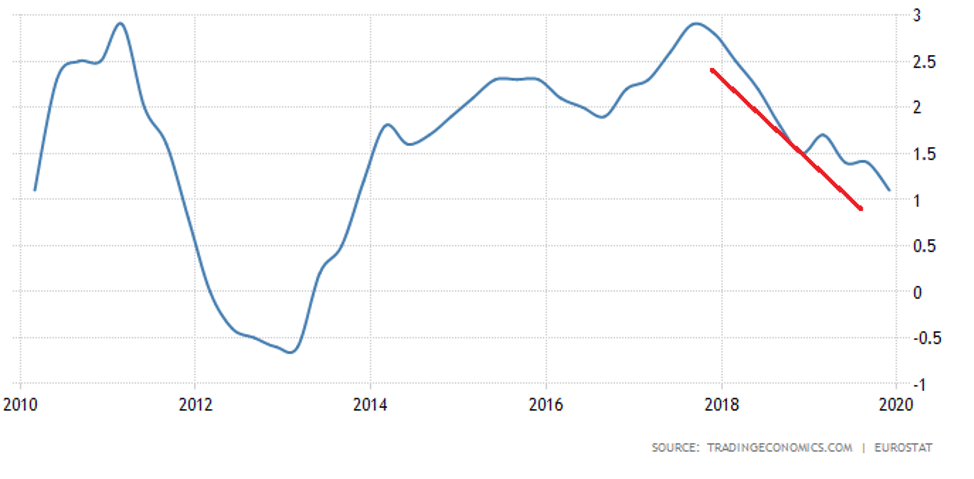
Furthermore, despite the Euro Area interest rate being near zero for years, the European Central Bank unveiled a fresh stimulus package in September. The move included a 10 basis point cut to the deposit rate (dropping the rate to minus 0.5%), which is what banks pay to park excess reserves. The central bank also announced plans to pump €20 billion a month into bond purchases in a bid to buoy confidence. So far, it hasn’t helped. Growth in the Eurozone clocked in at 0.1% last quarter — marking a seven-year low. The last time EU GDP plummeted, it didn’t stop falling until the EU entered a recession for the better part of a year (see chart above). With EU GDP deteriorating and Eurozone growth stalling out, we wouldn’t be surprised to see Europe slip back into recession before the end of 2020.
China’s Debt Bomb Threatens Global Economy
China has growth problems of its own. The economic and sociopolitical ramifications of the tragic coronavirus outbreak are all but guaranteed to take a toll on China’s economy and reputation. Moody’s Analytics recently lowered China’s 2020 GDP forecast from 6.1% to 5.3%. In 2019, China grew at 6.1% — its lowest level since 1990. For China’s GDP to fall almost another full percentage point in 2020 is disastrous for the Communist Party of China. Many economists already believe China’s economy is growing at about half the reported levels. But it gets worse. According to Fortune.com,
“Besides the trade dispute, 2019 was a record year for Chinese companies defaulting on bond payments, a trend that S&P estimates will continue in 2020.”
We’ve been warning about China’s corporate debt default problem for some time. In a May 11th, 2019 Weekly Intelligence Newsletter titled, Trump Trade Wars Update – China Has No Choice, we stated,
“Corporate debt has ballooned out of control and is now coming home to roost. China’s corporate debt to GDP exploded to over 160% in 2017.”
The below image highlights corporate debt (green), government debt to GDP (blue), and household debt to GDP (purple). China’s corporate debt is massive compared to its household and government debt levels.

In December of 2019, CNBC published an article titled, Chinese corporate debt is the ‘biggest threat’ to the global economy, says Moody’s chief economist. The article stated,
“Fitch Ratings said last week that a record high of 4.9% of China’s private issuers defaulted on onshore bond payments — or yuan-denominated bonds — in the first 11 months of 2019, a jump from 0.6% in 2014.”
In short, many Chinese corporations are defaulting at a time when its government and citizens are piling on debt like never before.
China Households Debt to GDP
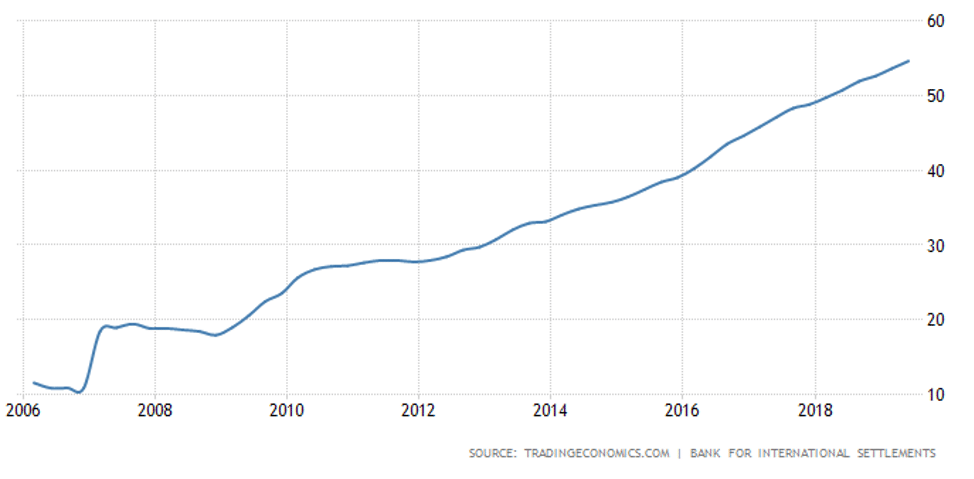 At the beginning of this newsletter, we noted that the United States’ household debt to GDP ratio had declined from nearly 100% to 75% since the Great Recession. In comparison, China’s household debt to GDP ratio has exploded from sub 20% to approximately 55%.
China’s Debt Tops 300% of GDP
Since our report in May of 2019, China’s debt situation has worsened across the board. In July 2019, Reuters reported, China’s debt tops 300% of GDP, now 15% of global total: IIF. Then, in mid-January of this year, CNBC published, Global debt hits new record of $253 trillion and is set to grow even more this year. The warnings regarding China’s growing debt levels were the same:
“China’s household and general government debt are now at all-time highs of 55% of its GDP (gross domestic product), according to the IIF. Overall Chinese debt is close to 310% of GDP — one of the highest in emerging markets, the report said.”
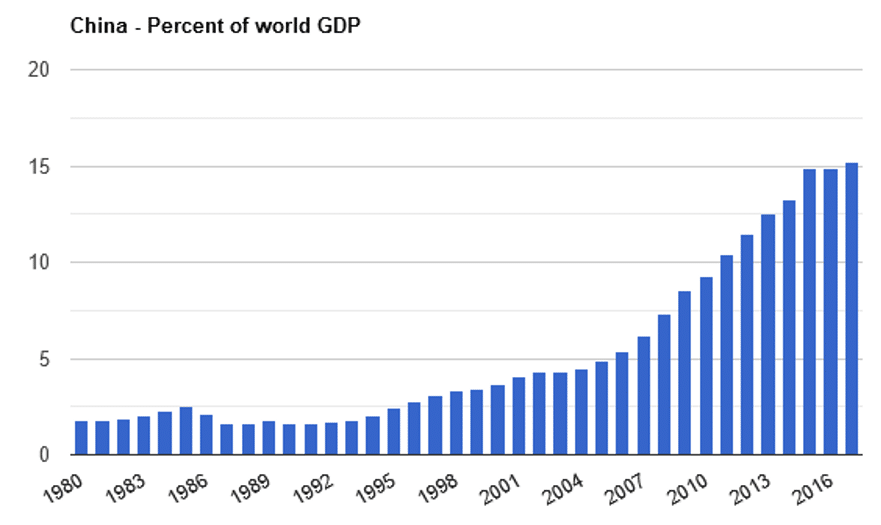
Under the weight of corporate debt and defaults (as well as Covid-19, the official name for the coronavirus that originated in Wuhan, China), China could be approaching a historic moment of economic contraction. Now, imagine a scenario where China — the world’s most populous country and second-largest economy on earth — enters recession. Despite consistently declining GDP over the past ten years, China still makes up more than 15% of world GDP. A recession in China would likely end the longest bull market in U.S. history…
China’s Share of Global GDP
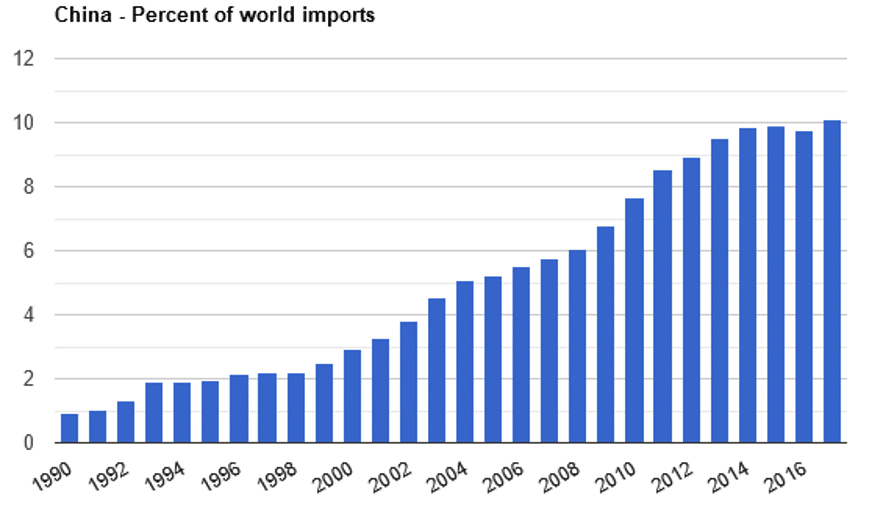
China accounts for 10% of world imports, behind only the US at 13%.
China’s Share of World Imports
Chinese Copper Case Study
Let’s take a quick look at copper to see the real-world impact of the coronavirus and uncertainty around China’s economy. It’s called “Doctor Copper” for a reason. Copper’s price is used to measure the health of the global economy, due to the metal’s many uses in infrastructure projects. As plants and ports across China shutter their doors in an effort to minimize the spread of Covid-19, BHP Group — the world’s largest mining company by market capitalization — is in talks to delay copper concentrate shipments to the country. According to Bloomberg,
“Copper prices had slid for a record 14 straight days in London amid mounting concerns the coronavirus will aggravate the slowdown in global economic growth, crimping demand for the metal used in cars, electronic gadgets and construction.”
Copper Spot Price – 6 Month Chart
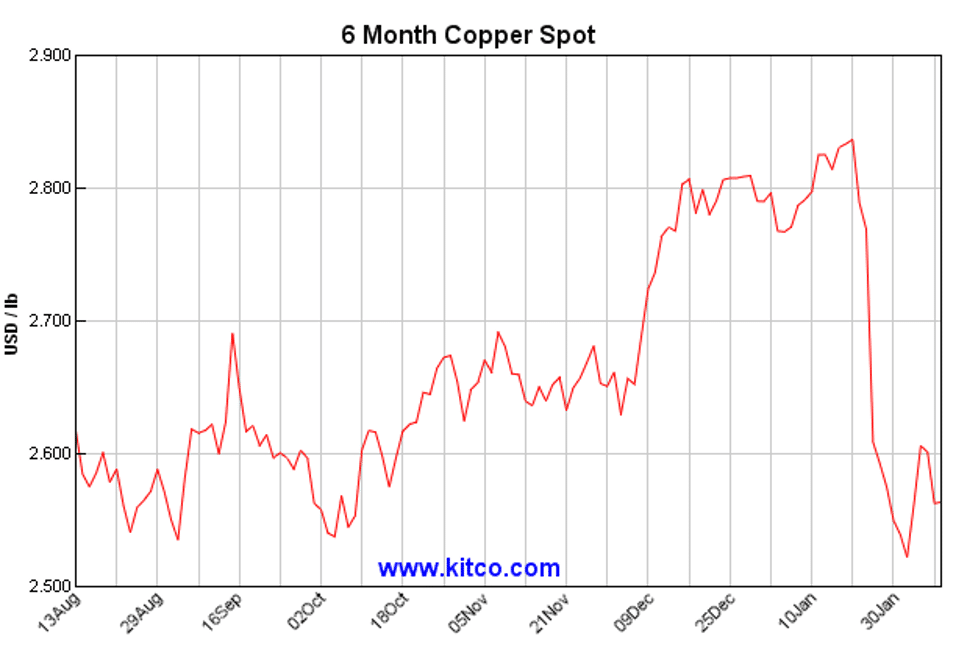
Looking at the chart above, it appears the price of copper collapsed once the market came to terms with the seriousness of Covid-19. The World Health Organization made their first official statement about the preliminary determination of a novel coronavirus in China on January 9, 2020. China consumes roughly half the world’s copper. To think base metal commodities like copper can perform well in a world where the Chinese economy is struggling is crazy.
Fed to Keep Longest Bull Market Alive
As the EU and China falter, the US will continue to attract investment. Case in point is the mind-blowing valuations given to some of the country’s largest companies. However, with Europe’s economy nearing decline and China’s on the brink, the US (and more specifically, the US Federal Reserve) will have to work harder than ever to keep the longest bull market in US history intact.
All the best with your investments,
PINNACLEDIGEST.COM
If you’re not already a member of our newsletter and you invest in TSX Venture and CSE stocks, what are you waiting for? Subscribe today. Only our best content will land in your inbox.


