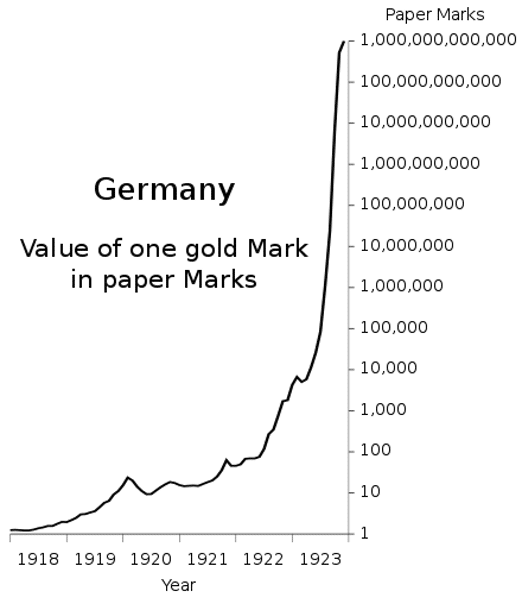
During the early 1920s in Weimar Germany, government-induced hyperinflation (via massive increases in the money supply) caused hunger and deteriorating standards of living.
When faced with the choice of economic collapse or printing more money, desperate, insolvent governments like the Weimar Republic have historically chosen the latter. Inflation is an insidious, often invisible tax. And like a disease, it can lay dormant/manageable for years before exploding out of control and attacking all corners of the economy.
When the German stock market began its bull run in the early 1920s, many were euphoric until the velocity of money increased and inflation moved into consumer goods.
Fast forward to the present day, and, ironically, the winds of deflation are all around us. However, our current fiat environment has strong potential to turn on a dime given the monetary and fiscal actions being taken by policymakers to combat COVID-19…
U.S. Floods Money Supply to Fight Deflation
By flooding the markets with more money, the U.S. may be overplaying its hand in its battle against deflation. Record monetary stimulus and ongoing increases to the M2 money supply (aka money stock), which we will detail shortly, could lead to rampant inflation if the velocity of money increases by 40% or more.
Last updated on April 29, 2020, the velocity of the M2 money stock, which measures the frequency at which one unit of currency is used to purchase domestically-produced goods and services, fell to a record low of 1.374 for Q1 2020…
While this should be taken as a deflationary signal, it’s important investors understand how inflation is still a threat in the coming years.
The Four Horsemen of Inflation
There are four leading causes of inflation that investors should be aware of:
- cost-push inflation
- demand-pull inflation
- an increase in the money supply
- a decrease in the demand for money
Let’s start with cost-push inflation, which Investopedia defines as,
“. . .the decrease in the aggregate supply of goods and services stemming from an increase in the cost of production.”
We are witnessing symptoms of this in Canada today as COVID-19 impacts food supply chains.
“COVID-19 has upended Canada’s food supply chains. Plants have shut down, grocery stores are struggling to keep their shelves stocked, and farmers have had to grapple with both labour shortages and produce gluts. As a result food prices are already rising.”
The second cause, demand-pull inflation, is defined by Investopedia as,
“…the increase in aggregate demand, categorized by the four sections of the macroeconomy.”
The four sections of the macroeconomy refers to households, businesses, governments, and foreign buyers. With unemployment at levels not seen since the Great Depression, an increase in demand for goods and services is not a problem today. However, if the employment picture improves quickly or more stimulus checks / tax breaks come into effect, demand for goods and services — and thus inflation — could spike.
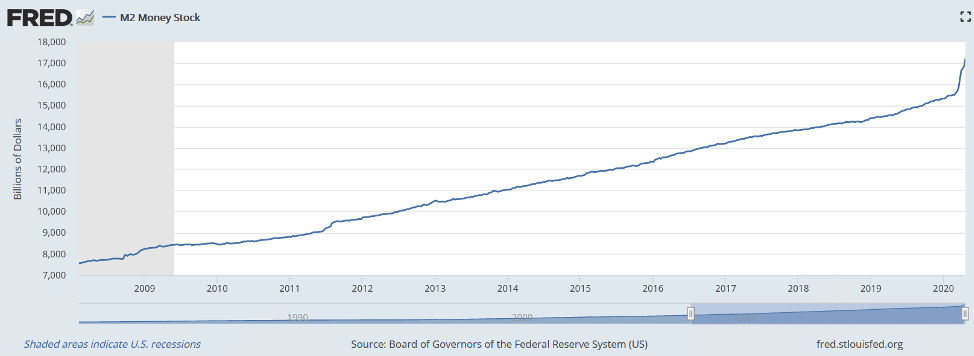
Next up is the third metric, an increase in the money supply. Today, we are witnessing by far the most significant increase in money supply in U.S. history.
M2 Money Supply Above $17 Trillion
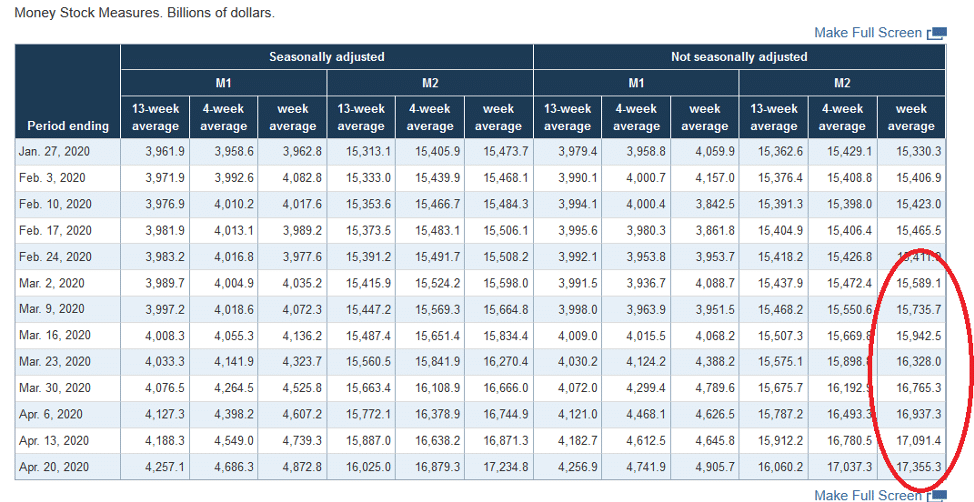
The below chart provides a more granular view of the increase in money supply between February and April 2020.
The dramatic rise in money supply has yet to effect the U.S. dollar which continues to trade strongly. It’s important that investors understand the relationship between M1 and M2 money, as this can provide insight into where an economy (and its monetary policy) could be headed next.
The Relationship between M1 and M2 Money
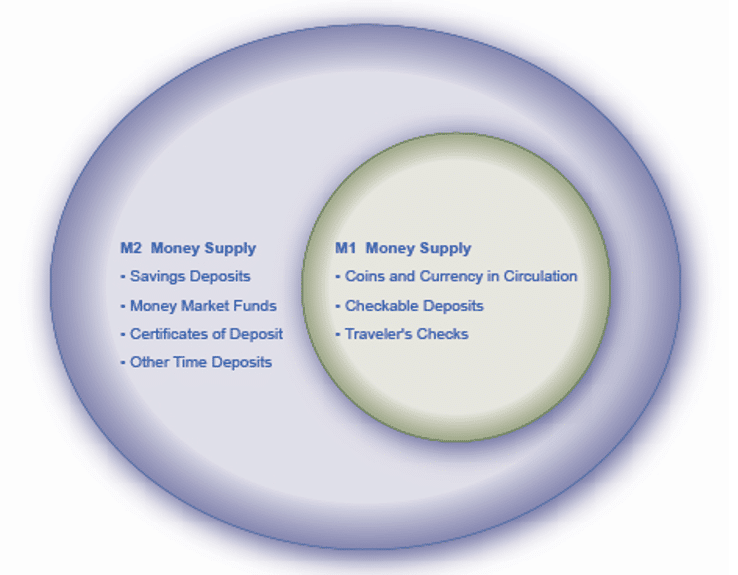
Note: According to Lumen Learning, “M1 and M2 money have several definitions, ranging from narrow to broad. M1 = coins and currency in circulation + checkable (demand) deposit + traveler’s checks. M2 = M1 + savings deposits + money market funds + certificates of deposit + other time deposits.”
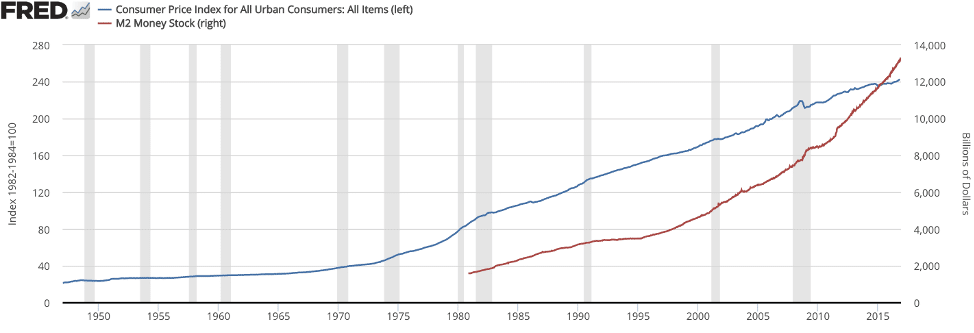
Another important relationship to understand besides M1 and M2 is the correlation between the Consumer Price Index (CPI) and the money supply. Historically, the CPI increases alongside the M2 money supply, as seen in the chart below.
Consumer Prices Rise with M2 Money Supply
According to InflationMatters.com,
“No one tells the population that the money supply has increased. The very first response to an increase in money supply is often for people to save, and so effectively they keep the amount of money in circulation the same. Therefore prices do not immediately change either. As that money spreads further around the economy, more and more gets into circulation. Prices then rise. Furthermore, money supply and velocity of money are often correlated. As money supply increases, velocity of money goes up (and vice versa in a recession) and so the price changes can be bigger than the money supply calculations alone might predict.”
Despite all the trillions of dollars the Fed has printed since the Great Recession, money velocity has continually declined. This has allowed the Fed to keep interest rates at zero and operate a system of debt monetization. If the velocity of money ever actually went up, the Fed would no longer be fighting deflation, but rather inflation.
InflationMatters.com continues,
“To further complicate matters, this process is very much dependent on where the increases in money supply have gone (i.e. into retail prices or into asset prices) and more generally on consumer sentiment and the state of the business climate and cycle. It is therefore not surprising that there is often little short-term synchronicity between the money supply and inflation.”
The fourth cause of inflation is a decrease in the demand for money. With Americans hoarding cash at the highest rate since 1981, this has yet to occur. On April 30, the U.S. Bureau of Economic Analysis confirmed the savings rate hit 13.1% in March — up from 8% in February. Again, a deflationary signal.
Taking all four causes of inflation into account, the risk of inflation appears low for the moment.
Inflation Will Wait Until 2021 and Beyond
While 2020 will not see broad inflation, prices for food and gold have appreciated amidst the current economic contraction. We believe this is a warning of inflation to come once economic activity demonstrates some semblance of normality.
All the best with your investments,
PINNACLEDIGEST.COM
If you’re not already a member of our newsletter and you invest in TSX Venture and CSE stocks, what are you waiting for? Subscribe today. Only our best content will land in your inbox.
