From the stock market to the grocery store, inflation is beginning to permeate American life.
Although the polls are strongly suggesting a Biden landslide, this inflation, combined with higher stock prices and a rebounding economy, will help President Trump’s odds of victory heading into the November 3rd election. Today’s inflationary forces will also change our lives and personal portfolios.
Inflation Rises as Money Supply Goes Parabolic
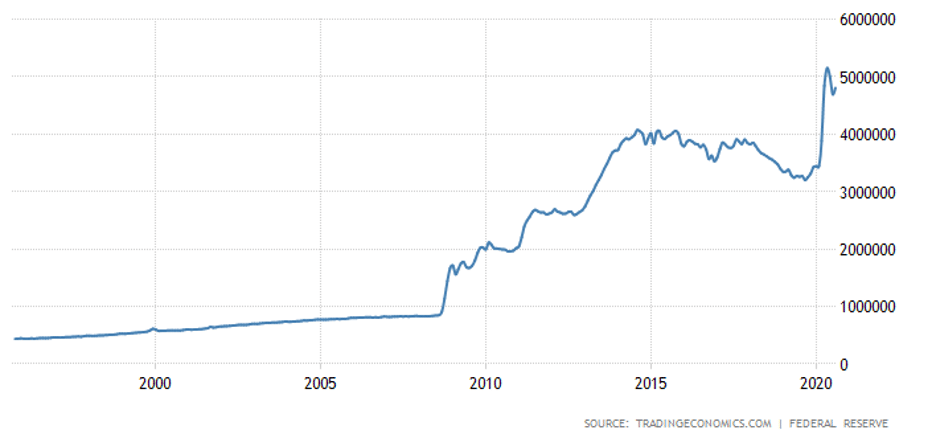
While the United States’ money supply has steadily increased over the decades, it wasn’t until 2008 that it went parabolic. After a brief pause following the Great Recession, it has continued to move higher.
United States Money Supply M0, which includes coins and notes in circulation, is the most liquid form of money.
United States Money Supply M0 – 25 Year Chart
Ironically, since 2008, virtually every increase in the money supply has been followed by a decrease in money velocity (this suggests significant deleveraging in the system).
Velocity of Money (VOM) Falls Through the Floor
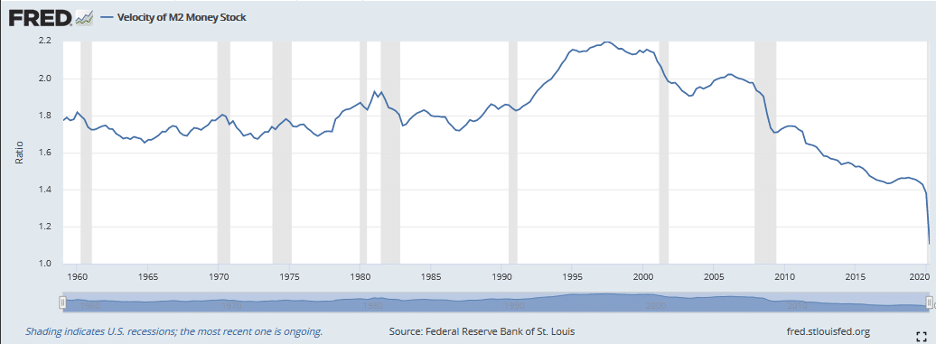
The St. Louis Fed defines money velocity as “the frequency at which one unit of currency is used to purchase domestically- produced goods and services within a given time period.”
For an economy on the ropes, a plunging VOM is frightening. It is the very essence of deflationary pressure and reveals exactly what the Fed and U.S. government are up against when it comes to stimulating the economy.
After peaking in the mid-to-late 90s, money velocity has been trending lower for almost 30 years. Here is a closer look at the decline; note the final two shaded areas represent the recessions of 2001 and 2008-2009:
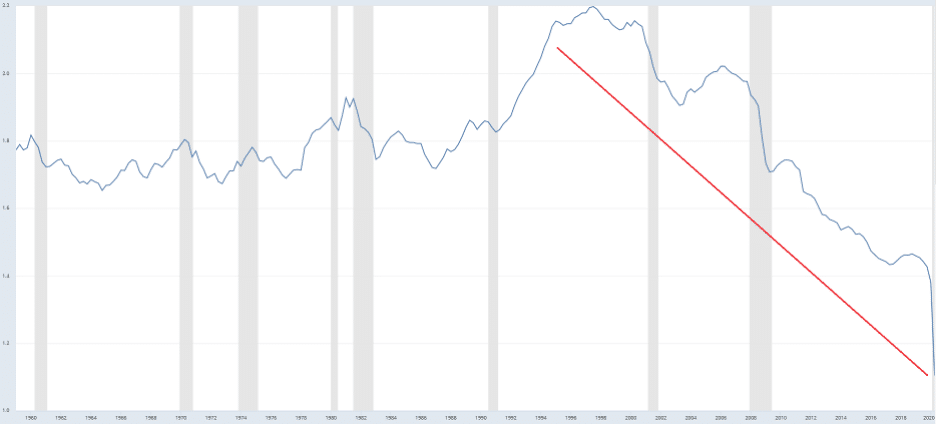
From about 2.2 in the late 90s to a shocking low of 1.10 in Q2 of 2020, the velocity of money is nearing 1.0. The Fed will not take this sitting down and may be about to bring out the big guns.
Stimulus is Coming, But How Much?
If the expanding U.S. Money Supply M0 tells us anything, it’s that inflation and money printing will continue no matter who sits in the Oval Office. Although the declining velocity of money could be taken as a sign deflation is winning, higher consumer staples prices suggest inflation is making a comeback…
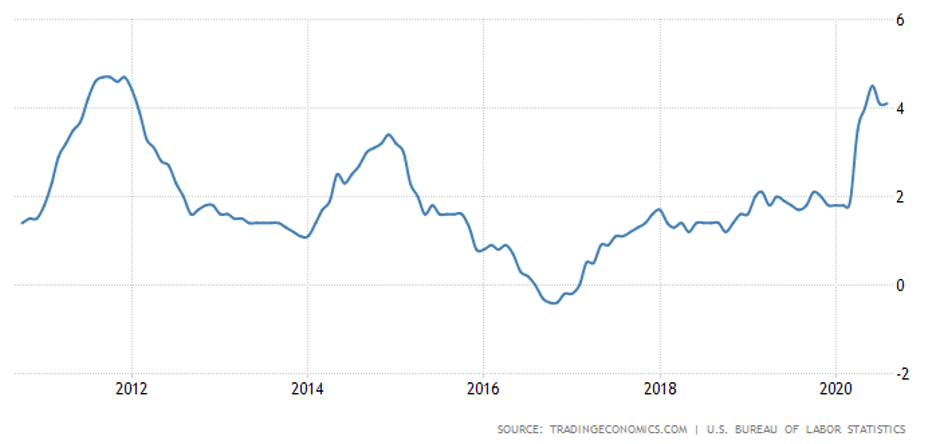
While the Fed wants inflation and a higher nominal stock market and real estate prices, the same cannot be said for food prices. The fact that U.S. food inflation increased an average of ~4% (compared to the same month in the previous year) between the months of April 2020 and August 2020 is an unintended consequence of the Fed’s actions. Food prices have only increased at such a rate three times in the last twenty-five years.
U.S. Food Inflation Running Near 10-Year Highs
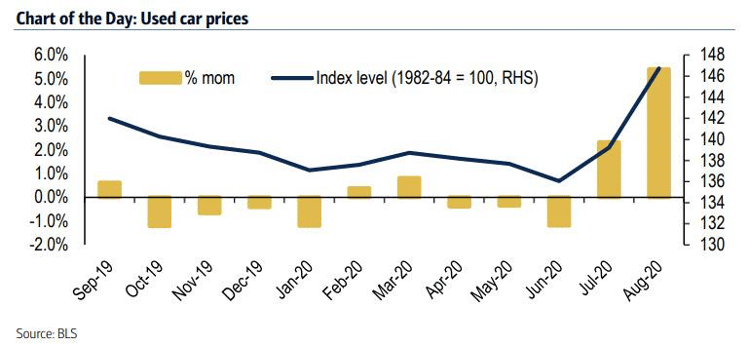
Food isn’t the only consumer staple on the rise. Due to several factors (some of which are related to COVID-19), used-car prices are now soaring.
According to a Zerohedge article titled, “On Some Measures, Inflation Is Already Above 2.5%”: Inflationary Lessons From The Used Car Market,
“. . .used cars are impacting both inflation and real activity: in July and August combined, used-car prices soared by 7.7%, the biggest two-month increase since 1969.”
However, despite a significant increase in the price of consumer staples like food and used cars, the U.S. economy is on track for its biggest quarter yet – a fact that certainly helps Trump’s re-election chances.
Biggest GDP Growth Quarter Ever Forthcoming
In a CNBC article titled, “Fed’s Bullard says ‘biggest growth quarter of all time’ will lift inflation,” St. Louis Federal Reserve President James Bullard states,
“It looks like 30% at an annual rate. Crazy number, way off the charts compared to anything we’re used to in U.S. post-war macroeconomic history.”
The Fed isn’t alone in its bullish outlook. Goldman Sachs is estimating 35% GDP growth for the 3rd quarter.
That said, context is important. The aforementioned article reminds readers at the end,
“U.S. gross domestic product contracted at a 31.7% annualized pace in the second quarter, owing to the unprecedented economic shutdowns instituted to slow the coronavirus pandemic.”
So, while the U.S. economy may be experiencing its biggest growth quarter of all time, it’s only gaining back what it lost to COVID-19. Although this recovery could play well to voters, it will be recovery and growth – like what Goldman Sachs is predicting – that could change the game for Trump.
Debt and Inflation Will Persist
From a purely statistical standpoint, much of the economic data is working in Trump’s favour. However, it remains to be seen if this is enough for Trump to secure a second term in the White House. As U.S. stocks trade near record all-time highs, U.S. national debt climbed above $27 trillion for the first time. After criticizing Obama to no end, Trump will add more in his first four-year term than Obama did in his eight-year tenure.
Regardless of who wins – whether it’s Biden or Trump – you can expect deficits to soar and inflation to ramp up.
All the best with your investments,
If you’re not already a member of our newsletter and you invest in TSX Venture and CSE stocks, what are you waiting for? Subscribe today. Only our best content will land in your inbox.